

This section contains the following topics:
Using Queries Tagged as Action Alert
Identifying Other Queries to Use for Alerts
Customizing Queries for Action Alerts
Working with CA IT PAM Event/Alert Output Processes
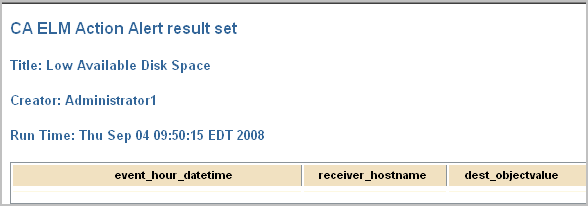
Example: Create an Action Alert for Low Disk Space
Example: Create an Alert for a Self-Monitoring Event
Example: Email the Administrator when Event Flow Stops
Configure Action Alert Retention
Example: Create an Alert for Business_Critical_Sources
Disable or Enable Action Alerts
Action Alerts are specialized reports that generate an event when their query conditions are fulfilled. They can help you monitor your environment - allowing automatic notifications for a wide variety of situations and occurrences. For example, you can set action alerts to deliver event trend information, track disk space usage, or deliver notifications when failed access thresholds are exceeded.
Action alerts are a good way to sift through mountains of collected data for those few events on which you need to act right now. You can use action alerts to notify you about almost anything that happens in your log collection network. You can create alerts to let you know about spikes in inbound or outbound traffic, traffic on specific ports, access of certain privileged resources, configuration changes to various network entities like firewalls, databases, or key servers, and so forth.
You can create action alerts in the following ways:
Scheduling options are a significant part of creating an alert, so you have control over how long and how often your alert job runs.
CA User Activity Reporting Module provides a number of queries with the tag, Action Alerts. To view the list of queries tagged Action Alerts, click the Queries and Reports tab, Queries subtab, and select the Action Alerts tag. The queries with this tag appear in the Query List. When you move your cursor over a query name, its tag or tags display.
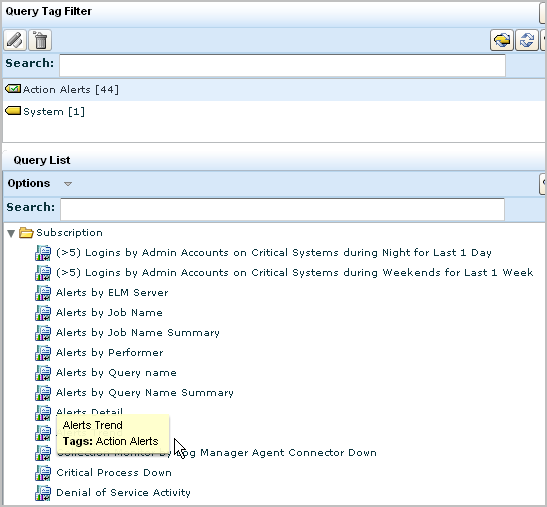
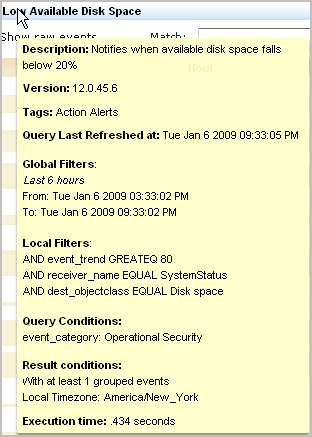
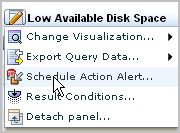
Before you schedule action alerts from these queries, you can get more information about what each of these queries do. To view a description and details on a query such as Low Available Disk Space, select that query form the query list, then move your cursor over the query name.
A summary of the query appears, including a description, its filters, and the query conditions.
. 
You can either schedule the query as is or you can copy the query to a new name and customize it to your requirements. For example, you can generate an alert when available disk space falls below 25 percent instead of 20 percent. You can create a user-defined query based on the predefined query and then select it for your action alert.
Note: Before using the queries with Privileged Group or Default Account in the title, consider adding your own keyed values for the corresponding keyed lists.
There are queries that are not tagged as Action Alerts that are good candidates for including in a scheduled action alert because they retrieve only events evaluated as severe.
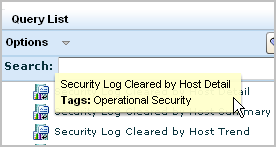
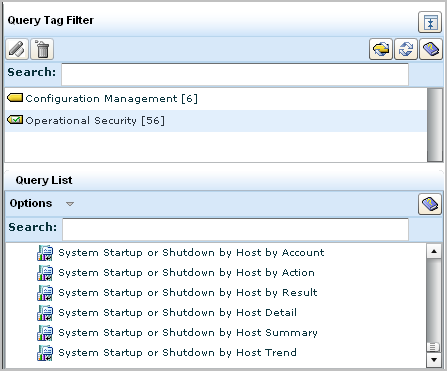
For example, Security Log Cleared by Host Detail retrieves all events where the event action is Security Log Clear. The only tag for this query is Operational Security.
The action, Security Log Clear, is listed in the CEG. The CEG defines the following two event types with a security level mapped to 6, which is severe.
|
Category |
Class |
Action |
Result |
Security Level |
|---|---|---|---|---|
|
Operational Security |
Security Log Activity |
Security Log Clear |
Success |
6 |
|
Operational Security |
Security Log Activity |
Security Log Clear |
Failure |
6 |
It is a good practice to schedule an alert with this query.
Alerts are designed to notify the appropriate person, process, or product when a severe event occurs. When attempting to identify queries on which to base alerts, consider queries designed to retrieve events with a high security level.
After you identify the definitions for severe events, you can identify the queries that retrieve severe events. If queries do not exist, you can create them.
Consider the following process:
Events vary in severity from informational to fatal. CA assigns a value between 2 and 7 to indicate the severity of events based on the CEG model of Category, Class, Action and Result. Severity 7 is assigned to system shutdown events. Severity 6 is assigned to events with high security implications or that need immediate attention.
If you plan to create custom queries or to customize predefined queries for use in alerts, it is a good idea to examine the CEG model definitions of severe event types. The model definition is the basis for simple filters. That is, you can create queries that retrieve events based on your specification of their event category, event class, event action, and event result.
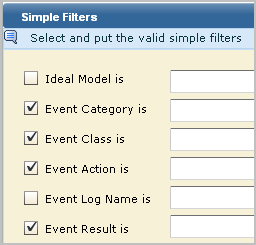
To identify the simple filter for severe events
The resulting table lists event types beginning with the most severe based on CA Security Level assignment.
An example follows. Your results will reflect the current CEG definitions.
|
Category |
Class |
Action |
Result |
Security Level |
|---|---|---|---|---|
|
Operational Security |
System Activity |
System Shutdown |
Success |
7 |
|
Operational Security |
System Activity |
System Shutdown |
Failure |
7 |
|
Configuration Management |
Configuration Management |
Configuration Error |
Success |
6 |
|
Data Access |
Object Management |
Control File Creation |
Success |
6 |
|
Host Security |
Antivirus Activity |
Scan Error |
Success |
6 |
|
Host Security |
Antivirus Activity |
Virus Clean |
Failure |
6 |
|
Host Security |
Antivirus Activity |
Virus Detected |
Success |
6 |
|
Host Security |
Antivirus Activity |
Virus Quarantine |
Failure |
6 |
|
Host Security |
IDS/IPS Activity |
Signature Violation |
Success |
6 |
|
Network Security |
Signature Violation Activity |
Signature Violation |
Success |
6 |
|
Operational Security |
System Activity |
System Startup |
Failure |
6 |
|
Operational Security |
Security Log Activity |
Security Log Clear |
Success |
6 |
|
Operational Security |
Security Log Activity |
Security Log Clear |
Failure |
6 |
|
System Access |
Authentication Activity |
Authentication Fallback |
Failure |
6 |
|
System Access |
Authentication Activity |
Authentication Start |
Failure |
6 |
You can create a query from scratch if you do not find a predefined query that retrieves the types of events you want to be notified about. Consider the following types of severe even types:
|
Category |
Class |
Action |
Result |
Security Level |
|---|---|---|---|---|
|
Host Security |
Antivirus Activity |
Virus Quarantine |
Failure |
6 |
|
Host Security |
IDS/IPS Activity |
Signature Violation |
Success |
6 |
|
Network Security |
Signature Violation Activity |
Signature Violation |
Success |
6 |
Example: Create a query to retrieve only virus quarantine failures
Assume, for example, that you want to be notified of any virus quarantine failure. Perhaps the keyword quarantine does not appear in the query list. If such were the case, you can create the query you need and then schedule an alert that runs the query.
To create a query to retrieve virus quarantine failures
Query Design wizard appears with the Details step displayed.
For example, enter Alert: Virus Quarantine Failure
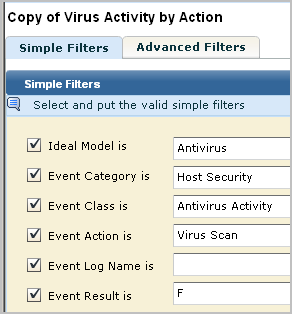
For example, enter Virus Quarantine
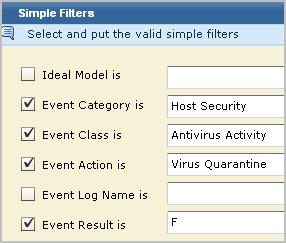
For example, select Host Security for category, Antivirus Activity for Class, Virus Quarantine for action, and F for result.
Predefined queries that are not tagged as action alerts are designed for reports. It is appropriate for reports to contain data reflecting events of all levels of severity. You can customize selected queries to retrieve only severe events. To do this, you identify a query that retrieves severe events along with less severe events, copy it, enter filters that ensure retrieval of only the severe event, and save it for selection in an alert.
Before you begin, have at hand your spreadsheet that lists the definitions of severe events. This example is based on the following CEG information:
|
Category |
Class |
Action |
Result |
Security Level |
|---|---|---|---|---|
|
Operational Security |
System Activity |
System Shutdown |
Success |
7 |
|
Operational Security |
System Activity |
System Shutdown |
Failure |
7 |
The query to customize retrieves events for both system shutdown and system startup.
To customize a query to retrieve only severe events
For example, select Operational Security.
For example, the keywords System Shutdown appear in queries beginning with the phrase System Startup or Shutdown by Host.
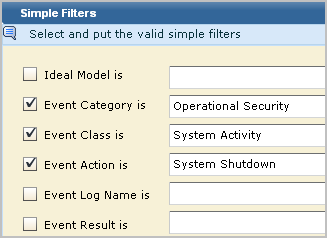
For this query, only Operational Security is selected.
For example, select System Activity for the Class and System Shutdown for the action.
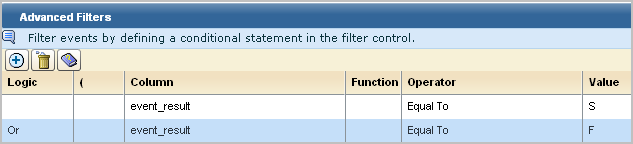
Click delete for each line since the filter event_action is equal to system startup or shutdown is not pertinent to this custom query.
For example, create a filter where event_result is equal to either success or failure.
For example, enter Alert: System Shutdown by Host Detail as the name. Change the description accordingly.
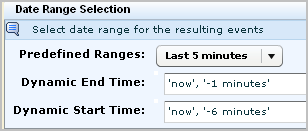
For example, select the predefined range for the last 5 minutes to run the query every 5 minutes for the occurrence of this severe event.
You can create an alert with this query to notify a person, product, or process of a system shutdown success or failed attempt. (Product notification is done through SNMP traps; process notification is done through IT PAM event/alert output.)
Consider modifying selected predefined queries for use with alerts. To customize the query, add the simple filter based on the CEG analysis. Set the Date Range Selection with the Predefined Range, Last 5 minutes to ensure immediate notification. A few examples follow:
Query for Successful Configuration Error
This query returns successes as well as failures. Only successes are needed.
|
Category |
Class |
Action |
Result |
Security Level |
|---|---|---|---|---|
|
Configuration Management |
Configuration Management |
Configuration Error |
Success |
6 |
Query for Successful Control File Creation
This query retrieves all data access actions.
|
Category |
Class |
Action |
Result |
Security Level |
|---|---|---|---|---|
|
Data Access |
Object Management |
Control File Creation |
Success |
6 |
Query for Antivirus Scan Failure
This query filters for all Antivirus host security actions.
|
Category |
Class |
Action |
Result |
Security Level |
|---|---|---|---|---|
|
Host Security |
Antivirus Activity |
Scan Error |
Success |
6 |
Query for Virus Cleaning Failure
You can use the predefined query Virus Detection or Cleaning Activity Detail to retrieve both actions with either success or failure results. This may be sufficient for your needs. Optionally, you can create two separate queries based on this query where you specify the result as indicated on the CEG table for severe events.
|
Category |
Class |
Action |
Result |
Security Level |
|---|---|---|---|---|
|
Host Security |
Antivirus Activity |
Virus Clean |
Failure |
6 |
Query for Successful Detection of a Virus
You can use the predefined query Virus Detection or Cleaning Activity Detail to retrieve both actions with either success or failure results. This may be sufficient for your needs. Optionally, you can create two separate queries based on this query where you specify the result as indicated on the CEG table for severe events.
|
Category |
Class |
Action |
Result |
Security Level |
|---|---|---|---|---|
|
Host Security |
Antivirus Activity |
Virus Detected |
Success |
6 |
You can view the results of any action alert from CA User Activity Reporting Module without any special configuration. Additionally, an action alert can be sent to the following destinations:
Administrators configure these destinations from the Administration tab, Services subtab, under either Global Configuration or Global Service Configuration: Report Server.
Ensure these destinations are configured as follows before attempting to schedule an alert.
The RSS Feed URL follows, where elmhostname is the host name of the CA User Activity Reporting Module server:
https://{elmhostname}:5250/spin/calm/getActionQueryRssFeeds.csp
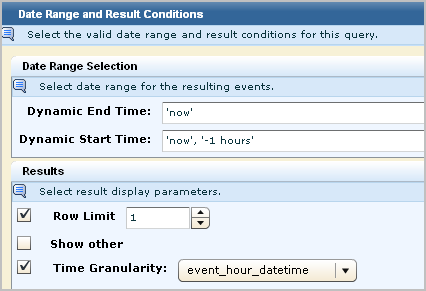
When you specify result conditions for an action alert, consider the following:
Note: Do not change the dynamic end time to 'now' or to 'now', '-1 minutes'. This change from the predefined value can cause incomplete data to be displayed when the URL is launched from the destination. For example, if event count is one of the values, the displayed count when viewed from the URL may be less than the displayed count when viewed from CA User Activity Reporting Module.
When you create an action alert schedule, consider the following:
Important! Your CA User Activity Reporting Module server time must be synchronized with your NTP server to ensure complete results are returned when the query is set to run at a high frequency.
Consider the following filtering options:
Before you configure thresholds for action alerts on a CA User Activity Reporting Module report server, consider the following:
Working with CA IT PAM event/alert output processes that are integrated with CA User Activity Reporting Module involves some combination of the following tasks:
CA User Activity Reporting Module detects events that require intervention. You can generate alerts as soon as unwanted events occur. Integration with CA IT PAM makes it possible for an alert to run an event/alert output process. Event/alert output processes are designed to invoke appropriate remedial actions by other products. That is, event/alert output processes are CA IT PAM processes that command other products to take specified actions on specified objects.
CA User Activity Reporting Module, CA IT PAM, and third-party products work together to protect your environment. CA User Activity Reporting Module automates the detection of unwanted events and the IT PAM event/alert output process invokes other products to take the appropriate series of responses.
Integration involves configuring the connection to the CA IT PAM server, specifying the process to run, and specifying the process parameters with default values.
Running the CA IT PAM process can be done on demand from a displayed query result (row) or through scheduled alerts. In both cases, parameter values such as summary and description can be tailored to provide supporting details to the destination product of the CA IT PAM process.
You need the following network components to run a CA IT PAM event/alert output process from an alert:
An overview of the work flow for leveraging a CA IT PAM event/alert output process follows:
Note: When users log in, all they can do is view the page with the associated query results.
Assume the following setup has occurred:
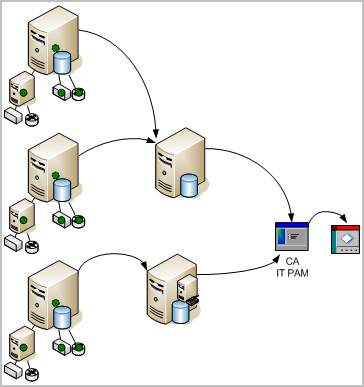
The end-to-end process involves actions by multiple sources:
A summary of the processing follows:
For example, when a configuration change is made on any system, a log is created and classified as a configuration change. The event captures the time of the change, the host where the change was made, the user who performed the change, and the result of the change attempt.
The arrows on the following diagram illustrate the data flow:
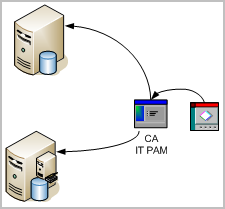
When CA User Activity Reporting Module receives notice that the send was successful, it polls CA IT PAM for the status of the process that was run. As soon as CA IT PAM sends the status update, CA User Activity Reporting Module creates a self-monitoring event with the result. The processing sequence follows:
Consider the example where the CA IT PAM process creates a help desk ticket with the process parameter values and the event data retrieved by the query. The arrows on the following diagram illustrate the following data flow:
To let you test CA IT PAM integration right away and practice the configuration procedure with known values, CA provides a sample process for this purpose. It is on the DVD with the application. Use of this sample IT PAM process assumes you are using CA Service Desk as your help desk application.
You can then configure CA IT PAM in CA User Activity Reporting Module and test running this sample CA IT PAM process with query results you select. After you become familiar with how CA User Activity Reporting Module operates with CA IT PAM, you can ensure compliance of your own process and substitute those values in the CA IT PAM configuration for your production integration.
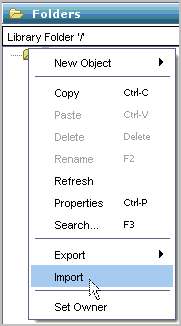
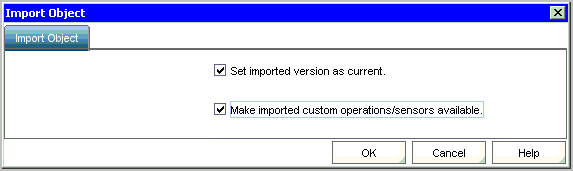
To import a sample process and test IT PAM integration

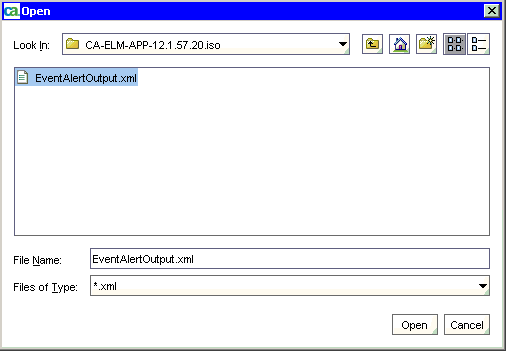
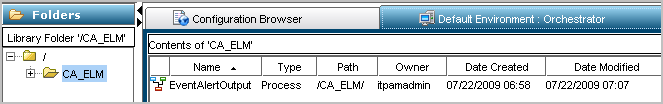
The resulting display shows the exact name and path. For example, the name is EventAlertOutput and the path is /CA_ELM/.
"http://<server name>:8080/axis/services/USD_R11_WebService"
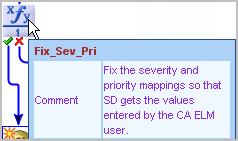
If you import the sample event/alert output process, you can examine its design in CA IT PAM. Use the following guidelines to become familiar with CA User Activity Reporting Module requirements in the context of the sample process. During this walk-through, you will see where to define web service connect parameters and how the calculation operators are defined. In addition, you will notice product-specific requirements. For example, configuring CA Service Desk as the third party product requires use of the Request_Create operator from the CA Service Desk Module and a precalculation operator that maintains values for severity and priority.
To become familiar with the sample event/alert out process
The name of your process and path appear in the main pane.
A model similar to the following appears. This example model contains minimal requirements for CA User Activity Reporting Module.
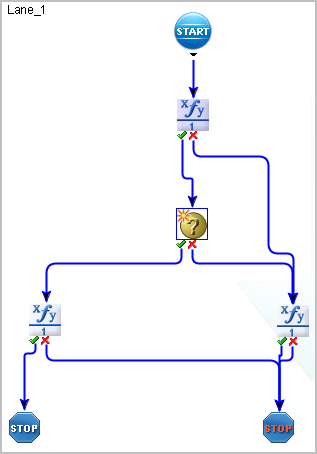
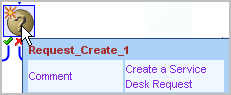
The Request_Create operator passes the data returned by the action alert query to your target product (application). A similar operator is required for any process that is to be run from CA User Activity Reporting Module.
BasicParameter = Process.LocalParameter
Note: Local process parameters are the Event/Alert Output Process Parameters you add to CA User Activity Reporting Module when you configure CA IT PAM.
|
ServiceDesk Basic Parameter |
Local Parameter |
Service Desk Field |
Notes |
|---|---|---|---|
|
Request Creator ID |
Process.ReportedBy |
Assignee,Reported By |
A valid "Contact" in CA Service Desk |
|
Summary |
Process.Summary |
Summary |
(Leave blank) |
|
Description |
Process.Description |
Description |
(Leave blank) |
|
Customer ID |
Process.EndUser |
Affected End User |
A valid "Contact" in CA Service Desk |
|
Priority |
Process.Priority |
Priority |
1-5 |
|
Severity |
Process.Severity |
Severity |
1-5 |
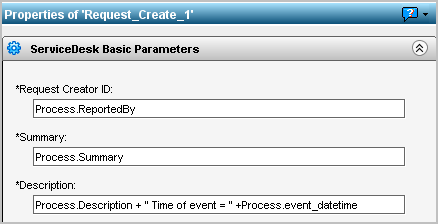
The following example shows valid local parameters for ServiceDesk Basic Parameters. The entries are case-sensitive. That is, Process.ReportedBy must be entered exactly as shown with a capital "R" and a capital "B" for example.
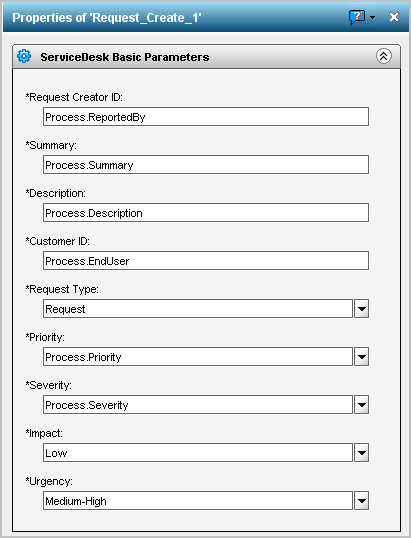
if (Process.Priority == 1) Process.Priority = "pri:504";
else if (Process.Priority == 2) Process.Priority = "pri:503";
else if (Process.Priority == 3) Process.Priority = "pri:502";
else if (Process.Priority == 4) Process.Priority = "pri:501";
else if (Process.Priority == 5) Process.Priority = "pri:500";
if (Process.Severity == 1) Process.Severity = "sev:800";
else if (Process.Severity == 2) Process.Severity = "sev:801";
else if (Process.Severity == 3) Process.Severity = "sev:802";
else if (Process.Severity == 4) Process.Severity = "sev:803";
else if (Process.Severity == 5) Process.Severity = "sev:804";
Process.ResultString = "Request " + Request_Create_1.newRequestNumber + " created in CA Service Desk.";
Process.FaultString = Request_Create_1.SoapErrorResponse;
Certain guidelines must be satisfied for a CA IT PAM process to run from CA User Activity Reporting Module. Before you attempt to run a CA IT PAM process from CA User Activity Reporting Module, verify that the process includes the following:
If your target IT PAM process is for a third-party help desk product, verify that the process also includes the following:
For example, a process that targets the BMC Remedy Module would be defined with the Create_Help_Desk_Case operator.
For example, a process that targets the BMC Remedy module would map local parameters to the HelpDesk Create Case Parameters.
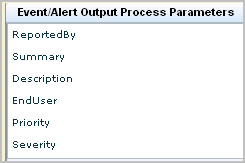
Typically, a CA IT PAM process includes only the default process parameters, each of which is mapped to a field in the third-party product. Optionally, you can add CEG fields as process parameters for a given process. The following example shows the following CEG fields in the dataset:
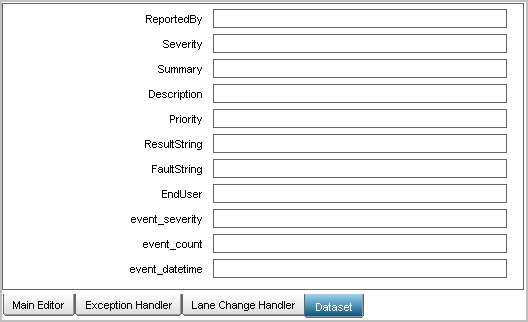
Each basic parameters is mapped to a Service Desk field. For example, the ReportedBy process parameter is mapped to the CA Service Desk field named Assignee. When CEG fields are added as process parameters, they can be referred to as values in a basic parameter. For example, the value for the CEG field event_datetime can be defined to appear in the Description field in CA Service Desk by default. This is achieved by adding the Process.event_datetime in the Description field of the Service Desk Basic Parameters.
When you create an alert that runs this process, examine the CEG fields listed under Send field values as parameters. If any listed parameter is a CEG field that you defined as a process parameter, select that field. Consider the following examples:
Most of the details required for CA IT PAM integration are part of the CA IT PAM product and process configurations. You can launch CA IT PAM and search for the details as you need them for configuration or you can gather the details first, record them, and then quickly configure CA IT PAM by entering the values you recorded.
You can reference either the sample processes you imported or your own processes that you have modified to meet CA User Activity Reporting Module requirements.
To gather details for CA IT PAM integration
|
IT PAM Configuration Field |
Description |
Your Value |
|---|---|---|
|
IT PAM Server |
The fully qualified host name of the server where CA IT PAM is installed. This value appears in the Server Name field on the Properties tab of the Configuration Browser |
|
|
IT PAM Port |
Port 8080 is the default This value appears in the Domain URL on the Properties tab of the Configuration Browser. |
8080 |
|
Username |
The user ID that CA User Activity Reporting Module is to use to log into IT PAM and run a process. Obtain from your CA IT PAM administrator Example: itpamadmin |
|
|
Password |
The password associated with the Username. Obtain from your CA IT PAM administrator. |
|
|
IT PAM Process-Specific Field |
Description and Example |
Your Value |
|---|---|---|
|
Event/Alert Output Process |
Path and process name. Identifies the process designed to pass details configured with the alert or a URL to an external product such as CA Service Desk. Example: /CA_ELM/EventAlertOutput |
|
|
Dynamic Values Process |
Path and process name. Identifies the process designed to collect values for the input key and return them for parsing into a csv file. Example: /CA_ELM/ValuesList |
|
|
Event/Alert Output Process Parameters |
Description and Example |
Your Value |
|---|---|---|
|
ReportedBy |
A valid ServiceDesk user name. |
|
|
Summary |
This text appears in the Service Desk request Summary field. For example “Request created from CA ELM” |
--- |
|
Description |
This text appears in the Service Desk request Description field. |
--- |
|
EndUser |
A valid ServiceDesk user name. |
|
|
Priority |
Sets the default priority. If no default is configured, record a value between 1 and 5. Example: 3 |
|
|
Severity |
Sets the default severity. If no default is configured, record a value between 1 and 5. Example: 4 |
|
All users are authorized to run a CA IT PAM process on demand. You can run the configured CA IT PAM event/alert output process with selected query results for any of the following purposes:
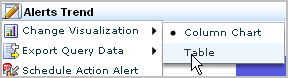
You can run a CA IT PAM process from a displayed query result row. This assumes the results are displayed as a table rather than a chart. You can display query result rows in any of the following ways:
Note: The following topic assumes that a query result row displays when you select the query from the query list.
To become familiar with what data is returned for the CEG fields, see the Common Event Grammar (CEG) Reference guide in online help.
To run the configured CA IT PAM process manually based on a displayed query result row
The query tag filter and the query list appear.
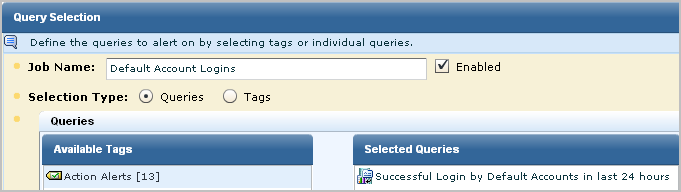
Events that reflect logins by default accounts are good candidates for forwarding to your CA IT PAM event/alert output process.
As an alternative, you can display the Reports subtab, select an option from the Report List, switch to individual query view, and select the query from this view.
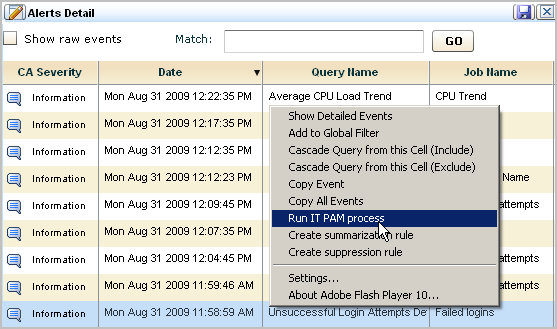
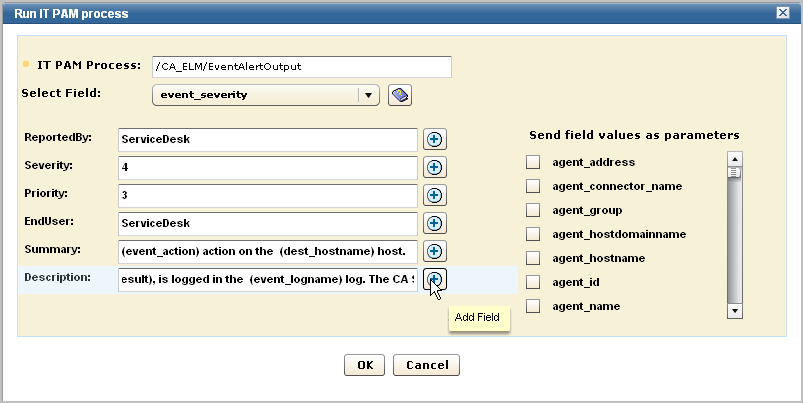
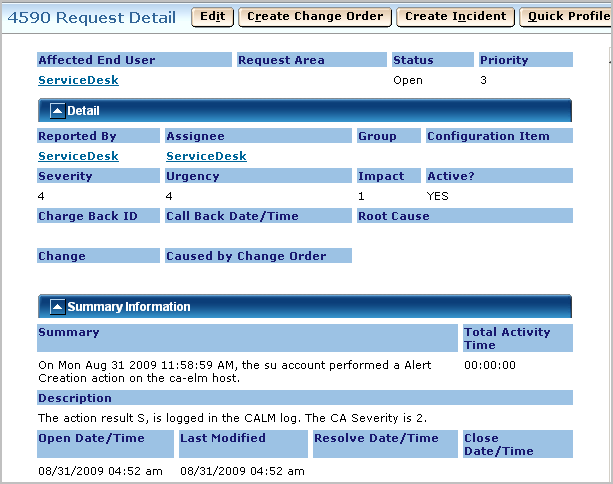
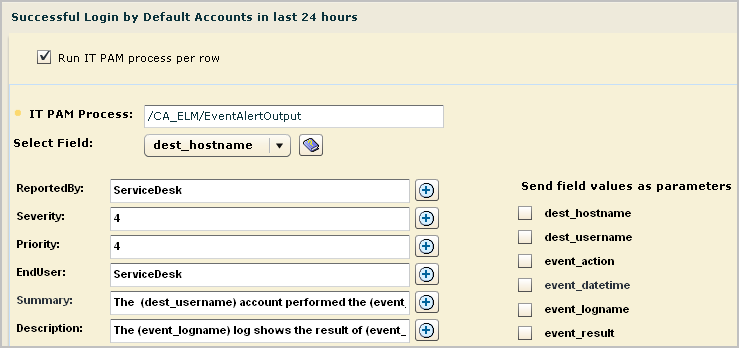
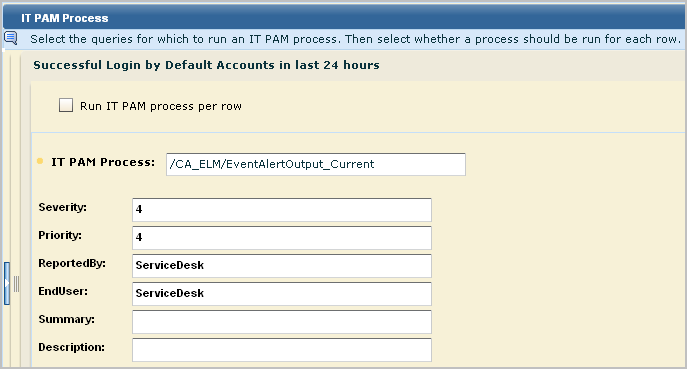
The Run IT PAM process dialog appears. It contains the process name and process parameters defined in the IT PAM configuration of the Report Server service. Additionally, it contains a Select Field drop-down list that allows you to enter variable data returned to the selected CEG field.
These parameters and their values are derived from the CA IT PAM integration configuration.
Example Summary: On (event_datetime), the (dest_username) account performed a (event_action) action on the (dest_hostname) host.
Example Description: The action result (event_result), is logged in the (event_logname) log. The CA Severity is (event_severity).
An example follows. Your display may include other fields defined in the custom IT PAM event/alert output process.
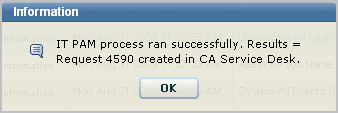
The progress dialog appears, followed by a message indicating whether the CA IT PAM process ran successfully, and if so, the results of running the process.
An example follows, where the result is Request 4590 created in Service Desk.
For example, select Request and enter 4590.
![]()
After you set up CA IT PAM integration, you can take the first step toward scheduling alerts that generate event/alert output--that of compiling a list of queries on which the alerts are to be based. These are typically queries for events that suggest a policy violation. You can take a combination of several approaches:
To identify or design queries on which to base alerts that run the CA IT PAM event/alert output process
This preparation ensures that when you schedule an alert that runs each such query or set of queries, the resulting event/alert output will contain the data required for resolution.
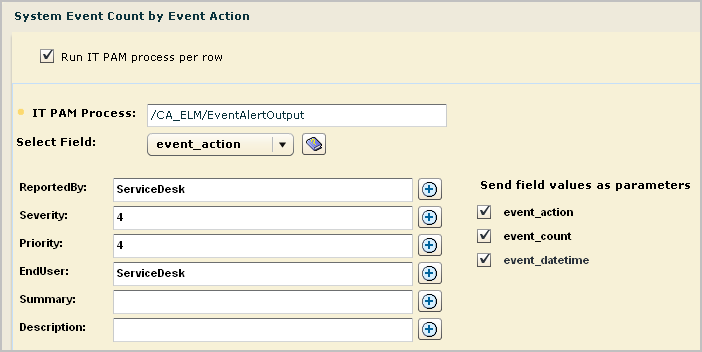
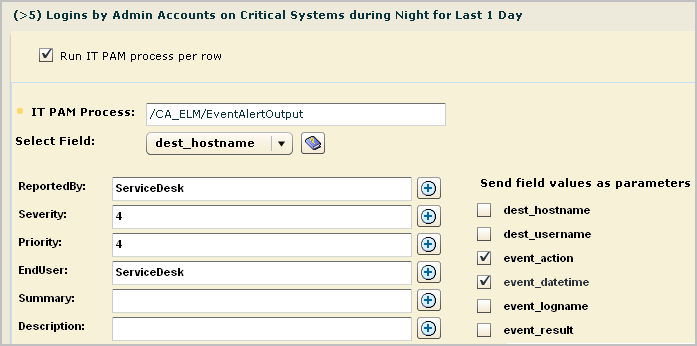
You can send an alert that runs the CA IT PAM event/alert output process per row or per query. This example illustrates the procedure of running the process per row. It includes an example of what can be viewed for this type of alert by personnel working with both CA IT PAM and the third-party product to which CA IT PAM sends the details.
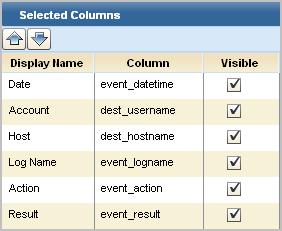
Prior to creating an alert to run an IT PAM process for a given query, it is a good practice to identify the CEG columns that return data. These columns are the ones to select when creating a summary and description statement for the alert.
Note: Copy the query and click the Query Columns step. For fields designed to be visible, notice the column name corresponding to the display name. For example, the CEG field used to populate the Account column is dest_username.
To create an alert when a default account member logs in successfully
The Schedule Action Alerts wizard appears.
The (dest_username) account performed the (event_action) action on (dest_hostname)
The first statement is created as follows:
The (event_logname) log shows the result of (event_result) on (event_datetime)
The(event_result) of the (event_action) is logged in the (event_logname) log.
The (event_logname) log shows the (event_action) action had a result of (event_result).
Note: Since the selected process does not use any CEG field names as parameters, no fields are checked in this example. To determine if a custom process uses such parameters, view the Dataset tab in the CA IT PAM event/alert output process.
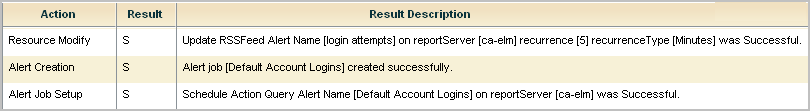
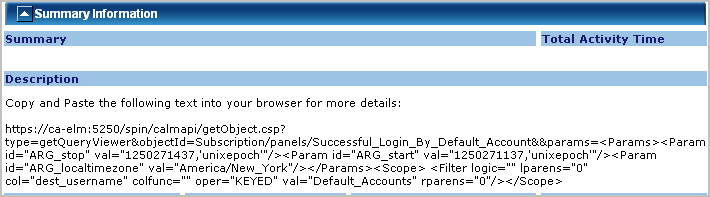
A partial example of a success message follows, where this message appears in the self monitoring events for the Report Server. Notice the ticket number following Results =.

You can send an alert that runs the CA IT PAM event/alert output process per row or per query. This example illustrates the procedure of running the process per query. It includes an example of what can be viewed for this type of alert by personnel working with the third-party product to which CA IT PAM sent the details.
To send an alert that runs the CA IT PAM event/alert output process per query
The Schedule Action Alerts wizard appears.
![]()

![]()
The CA User Activity Reporting Module logon dialog appears.
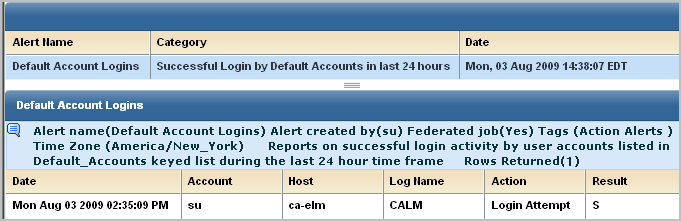
The event data returned by the query is presented in the format of the default view of the query, that is, table or chart.
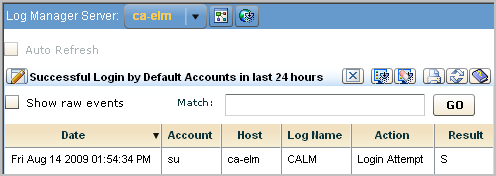
If the display is in table format, you can view raw event data.
Fault management systems and network operations centers (NOCs) typically receive SNMP traps. You can send alerts to such systems as SNMP v2 traps or SNMP v3 traps, depending on the destination product.
The only required tasks for working with SNMP traps follow:
Configuring a default SNMP trap destination is optional.
SNMP is the acronym for Simple Network Management Protocol, an open standard for sending alert messages to a specified destination. There are three versions of SNMP: SNMPv1, SNMPv2, and SNMPv3. CA User Activity Reporting Module can use either SNMPv2 or SNMPv3 to alert one or more third-party management systems when an event that generates an alert occurs.
In CA User Activity Reporting Module, an alert is generated when a scheduled query returns results from the event log databases of recently refined events. A scheduled query can be configured with SNMP trap as a destination. Trap receivers, the destination management systems, can process traps at the rate of approximately 200 traps per second. Trap receivers typically listen on UDP port 162, the well-known port for snmptrap.
CA User Activity Reporting Module gives you the flexibility to create your own custom alerts to send as SNMP traps. For example, you can define alerts that send notification that a critical event has occurred. You can also define alerts for events such as configuration changes. You decide which alerts to send as SNMP traps.
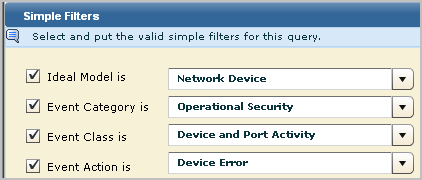
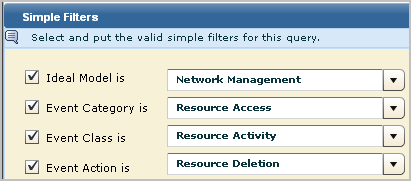
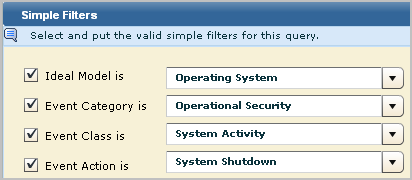
Events that negatively impact operations, such as shutdown of services, errors on devices, and deletion of resource, are of interest to Network Operations Centers (NOCs). You can generate action alerts when such events occur and route them to your NOC. You can create custom alerts for this purpose using Simple Filters in a custom query. Consider the following simple filter examples.
SNMP traps are defined in either standard Management Information Base (MIB) files or enterprise-specific MIBs.
Each private enterprise on the MIB tree has a unique number that is preceded by the numbers of its parent nodes. IANA assigned CA, Inc. the private enterprise number 791. All data sent in SNMP traps by any CA application is associated with object IDs that begin with 1.3.6.1.4.1.791. The CA User Activity Reporting Module application that belongs to CA has 9845 as its identifier. All SNMP trap data sent by CA User Activity Reporting Module action alerts is associated with object IDs (OIDs) beginning with 1.3.6.1.4.1.791.9845.
CA User Activity Reporting Module provides one MIB file. The name of this MIB is CA-ELM.MIB. This MIB defines all the fields that can be sent by action alerts with one trap. That trap includes all CEG fields available in CA User Activity Reporting Module.
When an action alert is sent to an SNMP trap destination, the data that is sent includes a URL. The individual monitoring incoming traps can browse the URL sent by the action alert. Browsing the URL launches a CA User Activity Reporting Module page that displays query results in an easy to read format. This functionality makes the use of MIBs to interpret data sent as SNMP traps unnecessary.
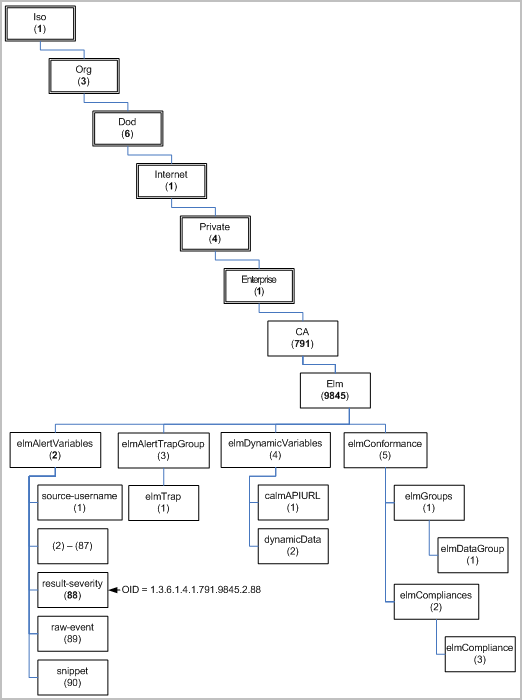
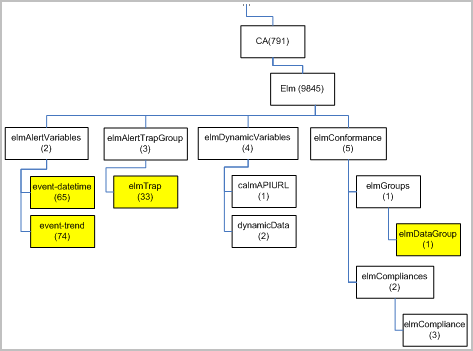
You can view the structure of the CA-ELM.MIB file in the MIB tree form. CEG fields are defined under elmAlertVariables with unique SNMP object identifiers. For example, result_severity has an OID of 1.3.6.1.4.1.791.9845.2.88.
The CA User Activity Reporting Module MIB file, CA-ELM.MIB, is on the installation DVD. The CA User Activity Reporting Module MIB is generated from the CEG source document, which contains the OIDs for each CEG field (elmAlertVariables).
The CA-ELM.MIB file begins with imports as follows:
CAELM-MIB DEFINITIONS ::= BEGIN

  IMPORTS
        MODULE-IDENTITY, OBJECT-TYPE, Integer32, NOTIFICATION-TYPE
                FROM SNMPv2-SMI
        MODULE-COMPLIANCE, OBJECT-GROUP,NOTIFICATION-GROUP
                FROM SNMPv2-CONF				DisplayString
                FROM SNMPv2-TC;
The following representation is designed to show the structure of the CA User Activity Reporting Module MIB tree, where the top-level nodes include iso(1) org(3) dod(6) internet(1) private(4) enterprises(1). The actual CA-ELM.MIB is not formatted like this representation.
ca OBJECT IDENTIFIER::= { enterprises 791 }
	elm MODULE-IDENTITY...::= { ca 9845 }
		elmAlertVariables      ::= { elm 2 }
			source-username    ::= { elmAlertVariables 1 }
			source-domainname  ::= { elmAlertVariables 2 }
			source-groupname   ::= { elmAlertVariables 3 }
                     ...
  			result-severity    ::= { elmAlertVariables 88 }
			raw-event          ::= { elmAlertVariables 89 }
			snippet            ::= { elmAlertVariables 90 }
		elmAlertTrapGroup      ::= { elm 3 }
			elmTrap            ::= { elmAlertTrapGroup 1 }
		elmDynamicVariables    ::= { elm 4 }
			calmAPIURL         ::= { elmDynamicVariables 1 }
			dynamicData        ::= { elmDynamicVariables 2 }
		elmConformance         ::= { elm 5 }
			elmGroups          ::= { elmConformance 1 }
				elmDataGroup   ::= { elmGroups 1 }
			elmCompliances     ::= { elmConformance 2 }
				elmCompliance  ::= { elmCompliances 3 }
The CA-ELM.MIB file defines one trap. That trap is defined as follows:
elmTrap NOTIFICATION-TYPE
    OBJECTS {  source-username,source-domainname,source-groupname,source-uid,source-gid,source-hostname,source-hostdomainname,source-address,source-mac-address,source-port,source-processname,source-objectname,source-objectattr,source-objectid,source-objectclass,source-objectvalue,dest-username,dest-domainname,dest-groupname,dest-uid,dest-gid,dest-hostname,dest-hostdomainname,dest-address,dest-mac-address,dest-port,dest-objectname,dest-objectattr,dest-objectid,dest-objectclass,dest-objectvalue,agent-name,agent-address,agent-hostname,agent-hostdomainname,agent-version,agent-id,agent-connector-name,agent-group,event-source-hostname,event-source-hostdomainname,event-source-address,event-source-processname,receiver-name,receiver-hostname,receiver-hostaddress,receiver-hostdomainname,receiver-port,receiver-time-gmt,receiver-timezone,receiver-version,event-protocol,event-logname,event-euuid,event-count,event-summarized,event-duration,event-time-year,event-time-month,event-time-monthday,event-time-weekday,event-time-hour,event-time-minute,event-time-gmt,event-datetime,event-year-datetime,event-month-datetime,event-day-datetime,event-hour-datetime,event-quarterhour-datetime,event-minute-datetime,event-timezone,event-sequence,event-trend,event-action,event-id,event-category,event-class,ideal-model,event-severity,event-result,result-string,result-signature,result-code,result-version,result-priority,result-scope,result-severity,raw-event,snippet }
    STATUS  current
    DESCRIPTION
            "The ELM SNMP Trap."
    ::= { elmAlertTrapGroup 1 }
The elmAlertTrapGroup is 1.3.6.1.4.1.791.9845.3 and the elmTrap is defined by the next node. The default elmTrap ID is 1.3.6.1.4.1.791.9845.3.1. User-defined Custom Trap IDs have the range 1.3.6.1.4.1.791.9845.3.2 to 1.3.6.1.4.1.791.9845.3.999.
Important! The best practice for sending traps to CA Spectrum is to use the default elmTrap ID. The best practice for sending traps to CA NSM is to specify a Custom Trap ID that references an elmTrap ID in a custom MIB.
The following table shows the CEG field corresponding to each Object ID (OID) under elmAlertVariables in the MIB tree. This branch of the tree will grow as new fields are added to the CEG. Be sure to check for updates to the MIB and be sure the latest version is available to your SNMP trap destination products.
|
Object ID (OID) |
CEG Field |
|---|---|
|
1.3.6.1.4.1.791.9845.2.1 |
source-username |
|
1.3.6.1.4.1.791.9845.2.2 |
source-domainname |
|
1.3.6.1.4.1.791.9845.2.3 |
source-groupname |
|
1.3.6.1.4.1.791.9845.2.4 |
source-uid |
|
1.3.6.1.4.1.791.9845.2.5 |
source-gid |
|
1.3.6.1.4.1.791.9845.2.6 |
source-hostname |
|
1.3.6.1.4.1.791.9845.2.7 |
source-hostdomainname |
|
1.3.6.1.4.1.791.9845.2.8 |
source-address |
|
1.3.6.1.4.1.791.9845.2.9 |
source-mac-address |
|
1.3.6.1.4.1.791.9845.2.10 |
source-port |
|
1.3.6.1.4.1.791.9845.2.11 |
source-processname |
|
1.3.6.1.4.1.791.9845.2.12 |
source-objectname |
|
1.3.6.1.4.1.791.9845.2.13 |
source-objectattr |
|
1.3.6.1.4.1.791.9845.2.14 |
source-objectid |
|
1.3.6.1.4.1.791.9845.2.15 |
source-objectclass |
|
1.3.6.1.4.1.791.9845.2.16 |
source-objectvalue |
|
1.3.6.1.4.1.791.9845.2.17 |
dest-username |
|
1.3.6.1.4.1.791.9845.2.18 |
dest-domainname |
|
1.3.6.1.4.1.791.9845.2.19 |
dest-groupname |
|
1.3.6.1.4.1.791.9845.2.20 |
dest-uid |
|
1.3.6.1.4.1.791.9845.2.21 |
dest-gid |
|
1.3.6.1.4.1.791.9845.2.22 |
dest-hostname |
|
1.3.6.1.4.1.791.9845.2.23 |
dest-hostdomainname |
|
1.3.6.1.4.1.791.9845.2.24 |
dest-address |
|
1.3.6.1.4.1.791.9845.2.25 |
dest-mac-address |
|
1.3.6.1.4.1.791.9845.2.26 |
dest-port |
|
1.3.6.1.4.1.791.9845.2.27 |
dest-objectname |
|
1.3.6.1.4.1.791.9845.2.28 |
dest-objectattr |
|
1.3.6.1.4.1.791.9845.2.29 |
dest-objectid |
|
1.3.6.1.4.1.791.9845.2.30 |
dest-objectclass |
|
1.3.6.1.4.1.791.9845.2.31 |
dest-objectvalue |
|
1.3.6.1.4.1.791.9845.2.32 |
agent-name |
|
1.3.6.1.4.1.791.9845.2.33 |
agent-address |
|
1.3.6.1.4.1.791.9845.2.34 |
agent-hostname |
|
1.3.6.1.4.1.791.9845.2.35 |
agent-hostdomainname |
|
1.3.6.1.4.1.791.9845.2.36 |
agent-version |
|
1.3.6.1.4.1.791.9845.2.37 |
agent-id |
|
1.3.6.1.4.1.791.9845.2.38 |
agent-connector-name |
|
1.3.6.1.4.1.791.9845.2.39 |
agent-group |
|
1.3.6.1.4.1.791.9845.2.40 |
event-source-hostname |
|
1.3.6.1.4.1.791.9845.2.41 |
event-source-hostdomainname |
|
1.3.6.1.4.1.791.9845.2.42 |
event-source-address |
|
1.3.6.1.4.1.791.9845.2.43 |
event-source-processname |
|
1.3.6.1.4.1.791.9845.2.44 |
receiver-name |
|
1.3.6.1.4.1.791.9845.2.45 |
receiver-hostname |
|
1.3.6.1.4.1.791.9845.2.46 |
receiver-hostaddress |
|
1.3.6.1.4.1.791.9845.2.47 |
receiver-hostdomainname |
|
1.3.6.1.4.1.791.9845.2.48 |
receiver-port |
|
1.3.6.1.4.1.791.9845.2.49 |
receiver-time-gmt |
|
1.3.6.1.4.1.791.9845.2.50 |
receiver-timezone |
|
1.3.6.1.4.1.791.9845.2.51 |
receiver-version |
|
1.3.6.1.4.1.791.9845.2.52 |
event-protocol |
|
1.3.6.1.4.1.791.9845.2.53 |
event-logname |
|
1.3.6.1.4.1.791.9845.2.54 |
event-euuid |
|
1.3.6.1.4.1.791.9845.2.55 |
event-count |
|
1.3.6.1.4.1.791.9845.2.56 |
event-summarized |
|
1.3.6.1.4.1.791.9845.2.57 |
event-duration |
|
1.3.6.1.4.1.791.9845.2.58 |
event-time-year |
|
1.3.6.1.4.1.791.9845.2.59 |
event-time-month |
|
1.3.6.1.4.1.791.9845.2.60 |
event-time-monthday |
|
1.3.6.1.4.1.791.9845.2.61 |
event-time-weekday |
|
1.3.6.1.4.1.791.9845.2.62 |
event-time-hour |
|
1.3.6.1.4.1.791.9845.2.63 |
event-time-minute |
|
1.3.6.1.4.1.791.9845.2.64 |
event-time-gmt |
|
1.3.6.1.4.1.791.9845.2.65 |
event-datetime |
|
1.3.6.1.4.1.791.9845.2.66 |
event-year-datetime |
|
1.3.6.1.4.1.791.9845.2.67 |
event-month-datetime |
|
1.3.6.1.4.1.791.9845.2.68 |
event-day-datetime |
|
1.3.6.1.4.1.791.9845.2.69 |
event-hour-datetime |
|
1.3.6.1.4.1.791.9845.2.70 |
event-quarterhour-datetime |
|
1.3.6.1.4.1.791.9845.2.71 |
event-minute-datetime |
|
1.3.6.1.4.1.791.9845.2.72 |
event-timezone |
|
1.3.6.1.4.1.791.9845.2.73 |
event-sequence |
|
1.3.6.1.4.1.791.9845.2.74 |
event-trend |
|
1.3.6.1.4.1.791.9845.2.75 |
event-action |
|
1.3.6.1.4.1.791.9845.2.76 |
event-id |
|
1.3.6.1.4.1.791.9845.2.77 |
event-category |
|
1.3.6.1.4.1.791.9845.2.78 |
event-class |
|
1.3.6.1.4.1.791.9845.2.79 |
ideal-model |
|
1.3.6.1.4.1.791.9845.2.80 |
event-severity |
|
1.3.6.1.4.1.791.9845.2.81 |
event-result |
|
1.3.6.1.4.1.791.9845.2.82 |
result-string |
|
1.3.6.1.4.1.791.9845.2.83 |
result-signature |
|
1.3.6.1.4.1.791.9845.2.84 |
result-code |
|
1.3.6.1.4.1.791.9845.2.85 |
result-version |
|
1.3.6.1.4.1.791.9845.2.86 |
result-priority |
|
1.3.6.1.4.1.791.9845.2.87 |
result-scope |
|
1.3.6.1.4.1.791.9845.2.88 |
result-severity |
|
1.3.6.1.4.1.791.9845.2.89 |
raw-event |
You can create custom MIB files from the provided boilerplate text by adding selected varbinds from the CA-ELM.MIB file content. A custom MIB file for a single alert contains a subset of the contents of the CA-ELM.MIB file. A custom MIB for an alert differs from CA-ELM.MIB in these ways:
Note: An alert that uses a custom MIB specifies this OID as the value for Custom Trap ID.
Calculations can be applied to any field. The event_count field is an example field to which calculations are commonly, but not always, applied. Event_count in the query, System Event Count by Event Action, is a calculated field; it is calculated with Sum. To determine whether a field is calculated, examine the query where the field is defined. An example of a definition of event_count where it is a calculated field follows:
System_Event_Count_By_Event_Action.xml: <Column columnname="event_count" datatype="I" displayname="Count" functionname="sum" resultname="event_count" sortdesc="true" sortorder="1" visible="true"/>
Boilerplate text for a custom MIB follows. If you start a custom MIB with this example, you can replace or insert custom data in locations indicated with the string ###. In sections where you modify data, you can, optionally, modify the description.
CAELM-MIB DEFINITIONS ::= BEGIN
  IMPORTS
        MODULE-IDENTITY, OBJECT-TYPE, Integer32, NOTIFICATION-TYPE
                FROM SNMPv2-SMI
MODULE-COMPLIANCE, OBJECT-GROUP,NOTIFICATION-GROUP
                FROM SNMPv2-CONF				DisplayString
               FROM SNMPv2-TC;

elm MODULE-IDENTITY
    LAST-UPDATED "200907050600Z"
    ORGANIZATION "CA"
    CONTACT-INFO
        "100 Staples drive
        Framingham MA"
    DESCRIPTION
        "Contains objects describing data for ELM events"
    REVISION "200907050600Z"
    DESCRIPTION
        "Custom MIB <###>."
    ::= { ca 9845 }

ca OBJECT IDENTIFIER ::= {enterprises 791}
elmAlertTrapGroup OBJECT IDENTIFIER ::= { elm 3 }
elmAlertVariables OBJECT IDENTIFIER ::= { elm 2 }
elmDynamicVariables OBJECT IDENTIFIER ::= { elm 4 }
elmConformance OBJECT IDENTIFIER ::= { elm 5 }
elmGroups      OBJECT IDENTIFIER ::= { elmConformance 1 }
elmCompliances OBJECT IDENTIFIER ::= { elmConformance 2 }


<### Insert elmAlertVariable varbind for each query field ###>

<### Insert the following dynamicData varbind only if query includes calculated fields ###>
dynamicData OBJECT-TYPE
    SYNTAX  DisplayString
    MAX-ACCESS  read-only
    STATUS      current
    DESCRIPTION
" This field contains all the elm dynamic variables and data in name=value format."
    ::= { elmDynamicVariables 2 }

calmAPIURL OBJECT-TYPE
    SYNTAX  OCTET STRING
    MAX-ACCESS  read-only
    STATUS      current
    DESCRIPTION
"The OPEN API URL which points to the query result."
    ::= { elmDynamicVariables 1 }

elmTrap NOTIFICATION-TYPE
    OBJECTS { <### insert list of query fields with hyphens ###> }
    STATUS  current
    DESCRIPTION
            "The ELM SNMP Trap."
    ::= { elmAlertTrapGroup <### insert custom trap ID node number ###> }

elmCompliance MODULE-COMPLIANCE
    STATUS  current
    DESCRIPTION
            "The compliance information."
    MODULE  -- this module
        GROUP       elmDataGroup
        DESCRIPTION
            "This group is mandatory."
    ::= { elmCompliances 3 }
-- units of conformance

elmDataGroup    OBJECT-GROUP
    OBJECTS { <### insert list of query fields with hyphens ###> }
    STATUS  current
    DESCRIPTION
            "A collection of objects providing information specific to
            ELM data."
    ::= { elmGroups 1 }
END
Create a custom MIB for each query sent to CA NSM as an SNMP trap. Each such query is associated with a custom trap ID. The custom MIB defines the fields selected to include in the trap in the order displayed in the action alert.
Consider the example where the query selected for the action alert is Average CPU Load Trend. The selected fields are event_datetime and event_trend.
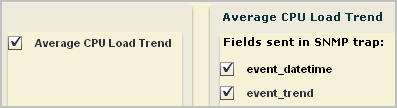
The Custom Trap ID is 1.3.6.1.4.1.791.9845.3.33.
![]()
To create a custom MIB for the custom trap ID ending in 33
Custom MIB 33."
<### Insert elmAlertVariable varbind for each query field in trap sequence ###>
Copy the elmAlertVariable varbinds for event_datetime and then for event_trend. These varbinds must appear in the MIB in the same sequence that they are sent in the SNMP trap. For example:
event-datetime OBJECT-TYPE
    SYNTAX  DisplayString
    MAX-ACCESS  read-only
    STATUS      current
    DESCRIPTION
"The calendar date and time expressed in the event information"
    ::= { elmAlertVariables 65 }
event-trend OBJECT-TYPE
    SYNTAX  Integer32
    MAX-ACCESS  read-only
    STATUS      current
    DESCRIPTION
"Trending data for this event."
    ::= { elmAlertVariables 74 }
<### Insert the following dynamicData varbind only if query includes calculated fields ###>
dynamicData OBJECT-TYPE
    SYNTAX  DisplayString
    MAX-ACCESS  read-only
    STATUS      current
    DESCRIPTION
" This field contains all the elm dynamic variables and data in name=value format."
    ::= { elmDynamicVariables 2 }
OBJECTS { <### insert list of query fields with hyphens ###> }
with the list of selected query fields, as follows:
OBJECTS { event-datetime,event-trend }
::= { elmAlertTrapGroup <### insert custom trap ID node number ###> }
with the following:
::= { elmAlertTrapGroup 33 }
OBJECTS { <### insert list of query fields with hyphens ###> }
with the following:
OBJECTS { event-datetime,event-trend }
The following example is a custom MIB developed for an action alert sent as an SNMP trap with the Custom Trap ID ending in 33. The custom trap ID was 1.3.6.1.4.1.791.9845.3.33. The selected query was Average CPU Load Trend and the fields selected to be sent in the SNMP trap are event_datetime, and event_trend.
CAELM-MIB DEFINITIONS ::= BEGIN
  IMPORTS
        MODULE-IDENTITY, OBJECT-TYPE, Integer32, NOTIFICATION-TYPE
                FROM SNMPv2-SMI
MODULE-COMPLIANCE, OBJECT-GROUP,NOTIFICATION-GROUP
                FROM SNMPv2-CONF				DisplayString
               FROM SNMPv2-TC;

elm MODULE-IDENTITY
    LAST-UPDATED "200907050600Z"
    ORGANIZATION "CA"
    CONTACT-INFO
        "100 Staples drive
        Framingham MA"
    DESCRIPTION
        "Contains objects describing data for ELM events"
    REVISION "200907050600Z"
    DESCRIPTION
        "Custom MIB 33."
    ::= { ca 9845 }

ca OBJECT IDENTIFIER ::= { enterprises 791}
elmAlertTrapGroup OBJECT IDENTIFIER ::= { elm 3 }
elmAlertVariables OBJECT IDENTIFIER ::= { elm 2 }
elmDynamicVariables OBJECT IDENTIFIER ::= { elm 4 }
elmConformance OBJECT IDENTIFIER ::= { elm 5 }
elmGroups      OBJECT IDENTIFIER ::= { elmConformance 1 }
elmCompliances OBJECT IDENTIFIER ::= { elmConformance 2 }

event-datetime OBJECT-TYPE
    SYNTAX  DisplayString
    MAX-ACCESS  read-only
    STATUS      current
    DESCRIPTION
"The calendar date and time expressed in the event information"
    ::= { elmAlertVariables 65 }

event-trend OBJECT-TYPE
    SYNTAX  Integer32
    MAX-ACCESS  read-only
    STATUS      current
    DESCRIPTION
"Trending data for this event."
    ::= { elmAlertVariables 74 }

calmAPIURL OBJECT-TYPE
    SYNTAX  OCTET STRING
    MAX-ACCESS  read-only
    STATUS      current
    DESCRIPTION
"The OPEN API URL which points to the query result."
    ::= { elmDynamicVariables 1 }

elmTrap NOTIFICATION-TYPE
    OBJECTS { event-datetime,event-trend }
    STATUS  current
    DESCRIPTION
            "The ELM SNMP Trap."
    ::= { elmAlertTrapGroup 33 }

elmCompliance MODULE-COMPLIANCE
    STATUS  current
    DESCRIPTION
            "The compliance information."
    MODULE  -- this module
        GROUP       elmDataGroup
        DESCRIPTION
            "This group is mandatory."
    ::= { elmCompliances 3 }
-- units of conformance

elmDataGroup    OBJECT-GROUP
    OBJECTS {  event-datetime,event-trend }
    STATUS  current
    DESCRIPTION
            "A collection of objects providing information specific to
            ELM data."
    ::= { elmGroups 1 }
END
The MIB tree for a custom MIB differs from the MIB tree for CA-ELM.MIB in the following ways:
A depiction of Custom MIB 33 in MIB tree format follows, where the highlighted blocks indicate differences between this custom MIB and the CA-ELM.MIB. The custom MIB defines only two fields under elmAlertVariables. The custom elmTrap includes only the two query fields and has a unique number, 33. The elmDataGroup includes only the two query fields.
For a system to understand an SNMP trap it receives from CA User Activity Reporting Module using MIBs, it must know what the composing OIDs define. Requirements follow:
Note: The same custom MIB can be used for alerts based on queries that send the same fields in the same order as a trap.
For example, the following queries all return values for the fields dest_hostname and event_count.
If you create separate alerts based on these queries, those alerts would specify the same Custom Trap ID and would be interpreted with the same custom MIB.
Individuals who monitor the SNMP traps received at the destination product can interpret traps sent from CA User Activity Reporting Module in two ways:
Using SNMP traps involves the following procedures:
Note: The CA-ELM.MIB is delivered on the installation DVD. You can download the latest version of this MIB from the CA User Activity Reporting Module product page.
Important! This step is optional because traps received from CA User Activity Reporting Module can be interpreted by launching the trap results page from the URL sent in the trap.
Configure SNMP integration as part of the Global Service Configuration for Report Server. The configuration is the IP address and port of one SNMP trap destination.
You can configure SNMP integration either before or after preparing the destination product to receive and interpret SNMP traps from CA User Activity Reporting Module.
When you create an alert destined for an SNMP trap recipient, you can specify one or more destinations. This configuration serves as the default. This default applies to all servers listed under Report Server.
To configure SNMP integration
You can send alerts in the form of SNMP traps from CA User Activity Reporting Module to any destination in your network that receives and interprets traps. Each trap receiver product has its own requirements.
Prepare CA Spectrum to receive traps from CA User Activity Reporting Module action alerts by:
The process for creating a southbound gateway integration is fully documented in the Spectrum Southbound Gateway Toolkit Guide. Creating a southbound gateway integration includes mapping SNMP traps to CA Spectrum events in an AlertMap file and defining the required models. The southbound gateway integration point accepts alert data from third-party systems and displays it within OneClick.
After downloading the MIB file from the CA User Activity Reporting Module product page on Support Online or retrieving it from the installation DVD, you can import it into CA Spectrum.
Before you can send SNMP V3 traps from CA User Activity Reporting Module to CA Spectrum, you must create a model of the CA User Activity Reporting Module appliance in CA Spectrum. SNMP v3 traps are then directed to the CA User Activity Reporting Module node that you modeled.
To create a model that enables Spectrum to receive SNMP v3 traps from action alerts
The SPECTRUM Control Panel appears with a Status indicator at the bottom of the screen.
OneClick Administration - SPECTRUM Control Panel appears with Host as localhost and Port as 80.
A login dialog appears.
The SPECTRUM NFM OneClick page appears.
The Login - SPECTRUM OneClick login dialog appears to connect you to SPECTRUM OneClick on local host.
The Console - SPECTRUM OneClick appears with a Navigation pane, a Contents pane, and a Component Detail pane.
The Contents and Component Detail pane titles display Universe of type Universe.
The second button on the tab lets you create a new model by type and add it to this view.
The Select Model Type - SPECTRUM OneClick dialog appears.
Model types beginning with Gn appear in the list.
The Create Model of Type <selected model type> opens.
The Edit SNMP v3 Profiles window appears with a list of existing profiles, if any.
The profile you added appears first in the V3 Profile drop-down list on the Create Model of Type dialog.
The Creating Model progress indicator appears. When processing completes, the created model appears on the Topology tab as a graphic with the host name that you entered and the model type you selected.
You can download the MIB file from the CA User Activity Reporting Module product page on Support Online or you can retrieve it from the installation DVD. After downloading the CA User Activity Reporting Module MIB, you can import/compile it into each product you configure as an SNMP trap destination.
To download the CA User Activity Reporting Module MIB
Before you send SNMP traps from CA User Activity Reporting Module to CA Spectrum, you can import and compile the CA User Activity Reporting Module MIB using the CA Spectrum OneClick MIB Tools.
Note: The SNMPv2 MIBs referenced in the CA-ELM.MIB are preloaded in CA Spectrum.
To import the CA-ELM.MIB into CA Spectrum
The MIB Tools: Add MIB dialog opens.
A success message indicates that the CA User Activity Reporting Module MIB is successfully stored in the following directory on the OneClick web server:
<$SPECROOT>/MibDatabase/userContrib
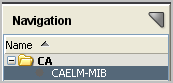
CAELM-MIB is added to the Navigation bar under CA.
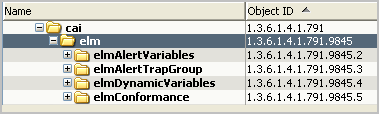
In the hierarchy, cai expands to display elm with its subordinate tree objects and their associated OIDs.
Before you send SNMP traps to CA Spectrum for the first time, it is a good practice to identify the queries that return results pertinent to this destination. When you schedule your first alert with Spectrum as a destination, you may want to track the progress and compare the results displayed in CA User Activity Reporting Module with those that appear in the CA Spectrum interface. Once sending traps to CA Spectrum becomes routine, you may not ever take these preparation and follow-up steps again.
The following example is designed to walk you through the initial process, including:
The following example shows how to create an alert that notifies CA Spectrum of configuration changes with SNMPv2 traps.
To send SNMPv2 traps to CA Spectrum
Selection of SNMP trap destinations is not allowed for alerts based on tags.
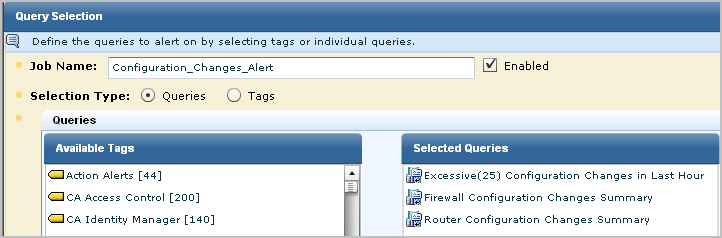
The configured SNMP Trap destination and the queries selected in step 1 of the wizard appear.
Note: By default, the SpectroSERVER listens on the standard SNMP trap port 162. If changed, the port must match the snmp_trap_port parameter in the SPECTRUM .vnmrc file located in the SS directory.
All fields of a selected query are selected by default. The name of the selected query appears above the field list.
Note: Some trap destination accept Version 3 traps sent directly by devices, but only Version 2 traps from applications that collect events from devices. For this example, we accept Version 2.
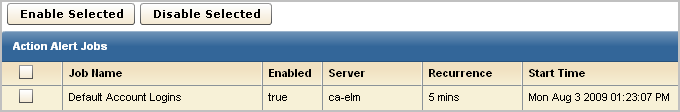
The job appears on the Action Alert Jobs list. Unless you cleared the Enabled check box on the first step of the wizard, it is displayed as enabled (true in the Enabled column). An abbreviated example follows:

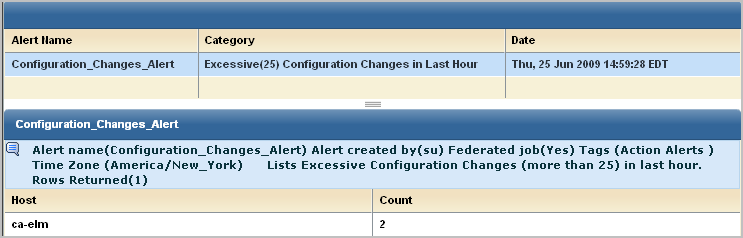
You can view results returned by the queries selected for the alert you created. The results displayed for the example Configuration_Changes_Alert are displayed in CA User Activity Reporting Module under the headings Host and Count.
Example results follow:
You can view the SNMP traps sent by CA User Activity Reporting Module alerts on the CA Spectrum event model you created for receiving these traps. Received traps are displayed on the Events tab. For the example Configuration_Changes_Alert, the results, ca-elm and 2, are displayed in CA Spectrum with the OIDs 1.3.6.1.4.1.791.9845.2.22 and 1.3.6.1.4.1.791.9845.2.2.
To view SNMP traps on CA Spectrum
Spectroserver starts.
The Spectrum NFM OneClick application appears.
The Spectrum OneClick console appears.
The value, ca-elm, and event_count=2 is the same data that you could view in CA User Activity Reporting Module.
An unrelated example of how an SNMP trap sent by a CA User Activity Reporting Module alert appears in CA Spectrum OneClick follows. The link is the URL you can paste in a browser to display the CA User Activity Reporting Module table with details presented in CEG format.
You can send alerts in the form of SNMP traps from CA User Activity Reporting Module to any destination in your network that receives and interprets traps. Each trap receiver product has its own requirements.
Prepare CA NSM to receive traps from alerts by:
Prepare CA NSM to interpret traps received from action alerts by:
You can send SNMP traps to CA NSM if your system meets the following CA User Activity Reporting Module interface requirements:
To apply the patch
The Services list appears.
Unicntrl stop all
Cazipxp.exe -u T5MK056.caz
A Copy of aws_snmpex.dll is added to the folder.
CA NSM now meets system requirements. You can configure CA NSM to receive SNMP traps from CA User Activity Reporting Module.
Before you can direct alerts to be sent to CA NSM as SNMP traps, you must configure CA NSM to receive traps. You can send both SNMPv2 traps and SNMPv3 traps to CA NSM.
To configure CA NSM to receive SNMP traps from CA User Activity Reporting Module alerts
caugui settings
The EM Settings window appears.
snmptrap 162/udp snmp-trap #SNMP trap
snmptrap    5162/udp
catrapmuxd   162/udp    catrapmuxd  #CA Trap Multiplexer
CATRAPMUX_CMD:6161
AWS_SNMP:6162
catrapd:6163
snmptrap:5162
Note: The first three entries represent default settings.
*.*.*.* *:* test1234:AuthPriv:MD5:test1234:DES:test1234
Note: These are the same parameters that you must enter in the V3 Security Parameters dialog in the Alert wizard in order for the SNMP trap to be received by CA NSM. The username and password are what you configure here, the Auth protocol is MD5 and the Encryption protocol is DES.
catrapmuxd uniconfig
CA Trap Multiplexer is added to the Services list with a status of Started.
The Services list appears.
Unicntrl start all
CA NSM is now configured to receive SNMP v3 traps based on scheduled alerts sent by CA User Activity Reporting Module.
The following example is designed to walk you through a process of alerting CA NSM of configuration changes. This process includes the following procedures:
When planning what alerts to send to CA NSM, identify query results that would be of interest to the network operations center. For example, consider queries that detect configuration changes. The following example illustrates how to send a scheduled alert based on the Configuration Change Detail query. This alert specifies CA NSM as the SNMP trap destination.
To send SNMPv3 traps to CA NSM
The SNMP Version 3 Security Parameters dialog appears.
Important: The entries on this dialog must match the settings in snmpv3.dat that you configured to enable CA NSM to receive SNMP traps from CA User Activity Reporting Module alerts. The recommended setting follows:
*.*.*.* *:* <username>:AuthPriv:MD5:<password>:DES:<password>
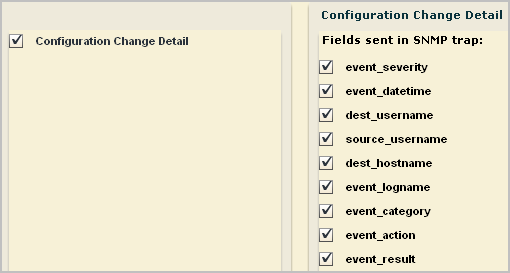
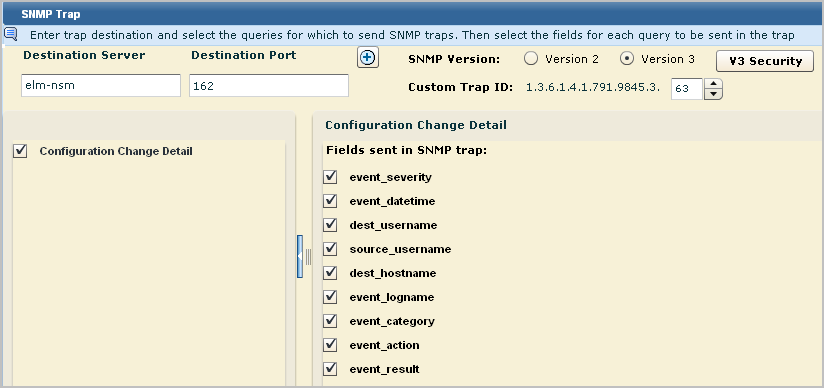
In this example, when you select Configuration Change Detail, the fields for that query are displayed as selected. Optionally, you can clear any field you do not want included as a trap.
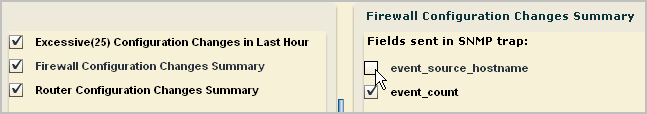
Important! When you create a custom MIB for this alert, be sure to define a trap with the fields you select here and in the order shown.
The initial nodes of the Custom Trap ID are predefined in the CA-ELM.MIB. The final node number is unique to a trap defined in a custom MIB, where the trap reflects a unique set of fields. A custom MIB file defines the traps sent by the CA User Activity Reporting Module alerts that you defined. In the custom trap referenced by the Custom Trap ID, the fields are listed in the same order as the fields sent by the alert. If the OID for the trap in the custom MIB is 1.3.6.1.4.1.791.9845.3.63, select 63 from the number spinner for Custom Trap ID. Or, if you define the alert first, add a trap in your custom MIB for 1.3.6.1.4.1.791.9845.3.63 that defines the query fields you selected.
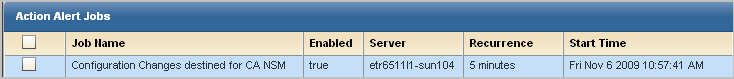
The job appears on the Action Alert Jobs list with the configured job name.
When you schedule an alert, it is a good practice to track the alert job progress the first time it runs. When you track progress, you can verify that the job runs successfully and that the reported results are what you intended to send.
To monitor the alert job progress and preview the results
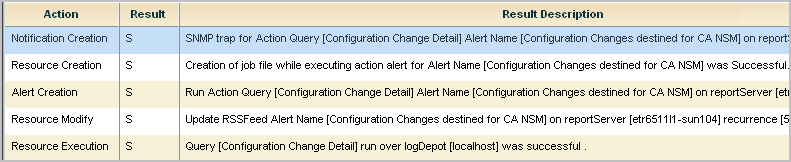
Note: Typically, the data displayed here is the data displayed when browsing the URL sent to the destination server. If a difference exists and you want it to be the same, edit the action alert to reset the dynamic end time for Result Conditions. For example, set it to 'now', '-10 minutes'.
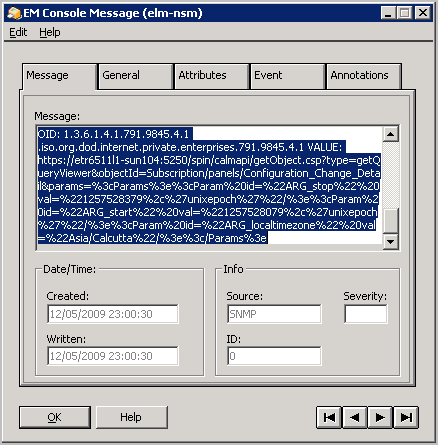
You can view the SNMP traps sent by CA User Activity Reporting Module from CA NSM. SNMP traps are displayed as messages on the EM Console.
To access the EM Console on CA NSM
The EM for Windows window appears.
The <hostname> (Windows) window appears.
The Event <hostname> (Windows) window appears.
The EM Console (<hostname>) appears.
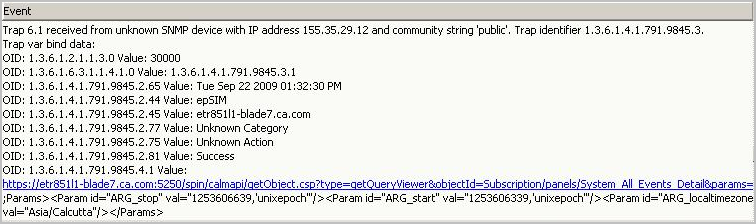
Consider the example where an alert is scheduled to run the Configuration Change Detail query. In this example, the Custom Trap ID is set to 1.3.6.1.4.1.791.9845.3.63. Nine fields are sent as an SNMP trap.
To view the SNMP trap sent by an Alert based on the Configuration Change Detail query
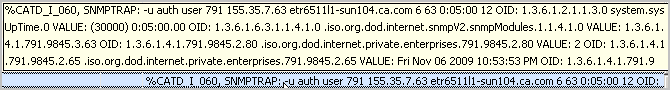
The results resemble the following:
%CATD_I_060, SNMPTRAP: -u auth user 791 155.35.7.63 etr6511l1-sun104.ca.com 6 63 0:05:00 12
Specifies that the following data is received as an SNMP trap.
OID: 1.3.6.1.2.1.1.3.0 system.sysUpTime.0 VALUE: (30000) 0:05:00.00
Specifies the object ID for uptime in hundredths of a second. This is a known OID through SNMP.
OID: 1.3.6.1.6.3.1.1.4.1.0 .iso.org.dod.internet.snmpV2.snmpModules.1.1.4.1.0 VALUE: 1.3.6.1.4.1.791.9845.3.63
Specifies the object ID for the snmpTrapOID. The value is the custom trap ID you specified when configuring the alert.
OID: 1.3.6.1.4.1.791.9845.2.80 .iso.org.dod.internet.private.enterprises.791.9845.2.80 VALUE: 2
Specifies the OID for event_severity and the severity value of 2, which stands for Informational.
OID: 1.3.6.1.4.1.791.9845.2.65 .iso.org.dod.internet.private.enterprises.791.9845.2.65 VALUE: Fri Nov 06 2009 10:53:53 PM
Specifies the OID for event_datetime with the value, the day, date and time when the event with these values occurred.
OID: 1.3.6.1.4.1.791.9845.2.17 .iso.org.dod.internet.private.enterprises.791.9845.2.17 VALUE:
Specifies the object ID for dest_username with no value.
OID: 1.3.6.1.4.1.791.9845.2.1 .iso.org.dod.internet.private.enterprises.791.9845.2.1 VALUE:
Specifies the object ID for source_username with no value.
OID: 1.3.6.1.4.1.791.9845.2.22 .iso.org.dod.internet.private.enterprises.791.9845.2.22 VALUE: etr851l2-elm5
Specifies the object ID for dest_hostname with the hostname of the server where the query results are displayed when you launch the URL.
OID: 1.3.6.1.4.1.791.9845.2.53 .iso.org.dod.internet.private.enterprises.791.9845.2.53 VALUE: EiamSdk
Specifies the object ID for event_logname, EiamSdk, the name of the log file that contains these details.
OID: 1.3.6.1.4.1.791.9845.2.77 .iso.org.dod.internet.private.enterprises.791.9845.2.77 VALUE: Configuration Management
Specifies the object ID for event_category and the value for Category associated with the Configuration Change Detail query.
OID: 1.3.6.1.4.1.791.9845.2.75 .iso.org.dod.internet.private.enterprises.791.9845.2.75 VALUE: Configuration Change
Specifies the object ID for event_action and the value for Action associated with the Configuration Change Detail query.
OID: 1.3.6.1.4.1.791.9845.2.81 .iso.org.dod.internet.private.enterprises.791.9845.2.81 VALUE: S
Specifies the object ID for event_result with the value, S, for Success.
OID: 1.3.6.1.4.1.791.9845.4.1 .iso.org.dod.internet.private.enterprises.791.9845.4.1 VALUE: https://etr6511l1-sun104:5250/spin/calmapi/getObject.csp?type=getQueryViewer&objectId=Subscription/panels/Configuration_Change_Detail¶ms=%3cParams%3e%3cParam%20id=%22ARG_stop%22%20val=%221257528379%2c%27unixepoch%27%22/%3e%3cParam%20id=%22ARG_start%22%20val=%221257528079%2c%27unixepoch%27%22/%3e%3cParam%20id=%22ARG_localtimezone%22%20val=%22Asia/Calcutta%22/%3e%3c/Params%3e
Specifies the object ID for calmAPIURL under elmDynamicVariables. The value is the URL to the CA User Activity Reporting Module API. After logging in, you can see the query results in the chart or graphic view.
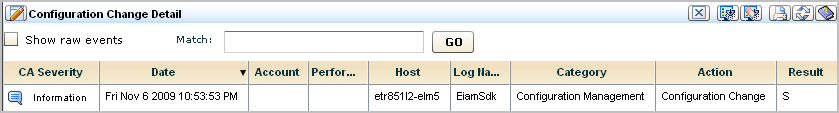
The Configuration Change Detail chart view displays. See the following example:
The process of creating an Action Alert, using the schedule action alert wizard, has the following main steps:
Note: You cannot base an action alert on an ODBC query.
To create an action alert job, you must use the schedule action alert wizard.
To open the schedule action alert wizard
The Alert Servers list appears.
The Server Details pane shows the selected server, displaying the Generated Alerts tab by default.
The Schedule Action Alerts wizard appears.
When using the wizard:
Select tags or queries as the basis for a new action alert job. The query, plus any filters you add, defines the circumstances under which an alert is generated. For example, to create an alert to monitor traffic from a host or port, use the All Events query, add filters to define the source hosts to monitor, and an event threshold.
Note: The Action Alerts query category contains queries designed for various common alert needs.
To select an alert query
Note: Scheduling alerts by tag lets you add alerts without altering the job itself. If you select the "Identity Management" Tag, any alert with that tag is added to the job at the scheduled run time. You can add a new alert to the job by giving a query the Identity Management tag. This feature also applies to custom tags.
(Optional) Clear the Enable check box to enable to action alert later rather than as soon as you finish it. The check box is selected by default.
Note: The ability to create a disabled alert job is designed for use with recurring alerts. If you clear the Enabled check box for a job, and create that job with a single occurrence ("Now" or "Once") it is removed from the Scheduled Alert list.
If you click Save and Close the alert job is scheduled, otherwise the step you select appears.
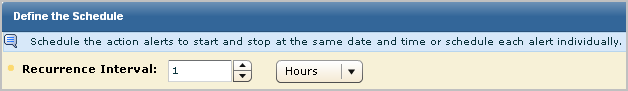
You can control when your alerts apply by setting their start and end time. You can also control how granular the alert view is by controlling how often the query recurs.
To set alert job scheduling parameters
Before setting a low interval, verify that CA User Activity Reporting Module is synchronized with an NTP server.
If you click Save and Close the alert job is scheduled, otherwise the step you choose appears.
You can set one or more of the following destinations for notification of an alert:
You can set automatic email notification for an alert to help ensure that the proper personnel are aware of alerts relating to their job role or responsibility. Configure a mail server for your CA User Activity Reporting Module environment before you send alert notification emails.
You can run the specified CA IT PAM process if the alert is for a condition that requires notification of the third-party product. Integration with CA IT PAM must be configured under Report Server and IT PAM must have the process defined before you can run the process from alerts.
You can send event data captured by an alert to one or more Network Operations Centers (NOCs). You can target management servers such as CA Spectrum or CA NSM using SNMP v2 or SNMP v3 traps. You specify the destinations during the process of scheduling the alert. Integration with SNMP must be configured before you can send alerts using SNMP.
Note: If you do not set a destination, the alert results are published only to the RSS feed.
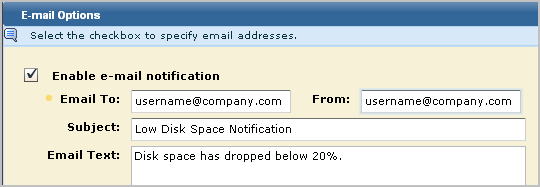
You can set automatic email notification for an alert job, assuring that the proper personnel are aware of alerts relating to their job role or responsibility. This step is optional.
A mail server must be configured for your CA User Activity Reporting Module environment before you can set alert notification emails.
To set alert notification
Note: The message body is constructed in HTML, so all text you enter appears on one line. To create a break after a line, enter <BR/> at the end of the line of text.
You can set your alert job to run a CA IT PAM process when the alert is generated.
You can run the process once for each query result row, or you can run the configured process once, regardless of the number of rows. If you run it once per row, define summary and description statements using CEG fields to pass the event data to CA IT PAM. Select the fields that are defined to collect data by the query. If you run it once per query, a URL is automatically passed to CA IT PAM that, when launched, displays all rows of event data. In the third-party product that responds to the CA IT PAM process, the URL is appended to the summary text you enter. For example, it appears in the Summary field of CA Service Desk, if it is the third-party product.
To run a CA IT PAM process when the alert is generated
A check box for each query for this alert job appears in the left pane.
Note: When the queries for a scheduled alert job return results, all the information and parameters required to run the configured process are sent to CA IT PAM.
You can set SNMP Trap inform for an alert job, allowing you to send the alert to one or more third-party management systems. When the selected queries return results, a trap that includes returned data for all selected fields from all selected queries is sent to all selected SNMP trap destinations. This step is optional.
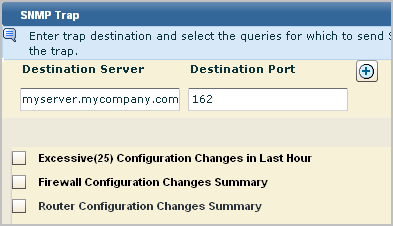
To set SNMP Trap information
The SNMP Trap tab opens, displaying the Destination Server and Destination Port fields, and a list of the queries included in the Action Alert, each with a check box.
Important: The entries on this dialog must match the settings in snmpv3.dat that you configured to enable CA NSM to receive SNMP traps from CA User Activity Reporting Module alerts. The recommended setting follows:
*.*.*.* *:* <username>:AuthPriv:MD5:<password>:DES:<password>
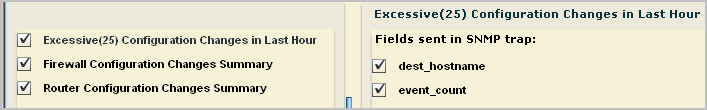
Selecting a query displays the fields included in each query, each with a check box selected. You can clear any selected field remove that field in the alert.
If you click Save and Close the alert job is scheduled, otherwise the step you select appears.
You can choose which federated event log stores are queried by the alert job.
To choose report destinations
If you click Save and Close the alert job is scheduled, otherwise the step you choose appears.
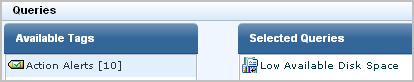
Low Available Disk Space is one of the predefined queries with the tag, Action Alerts. Queries with the Action Alerts tag are specifically designed to be used as alerts, but do not become alerts until you schedule them.
The following example shows how to create an action alert from the predefined Low Disk Space query.
The Query Tag and Query List panes appear.
The Query List displays the queries tagged with Action Alerts.
The Low Available Disk Space query appears in the main pane.
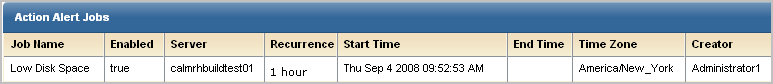
The Schedule Action Alerts wizard appears with the Alert Selection step selected. Low Available Disk Space is preselected under Selected Queries.
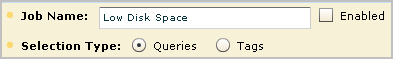
The action alert job is displayed on the Alert Scheduling subtab.
You will receive email notification as requested. An example follows:
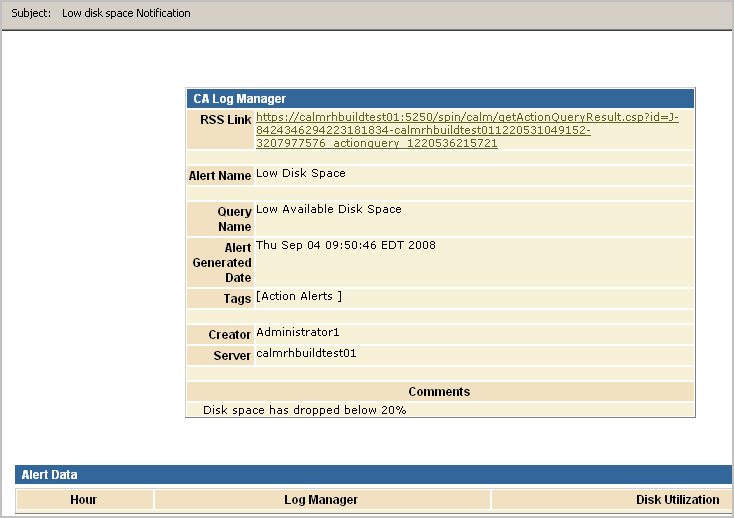
If you click the RSS Link, a page similar to the following appears:
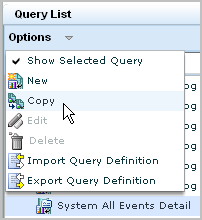
The predefined query for all self-monitoring events is System All Events Detail. You can copy this query and use it as the basis for defining an alert based on a specific self-monitoring event.
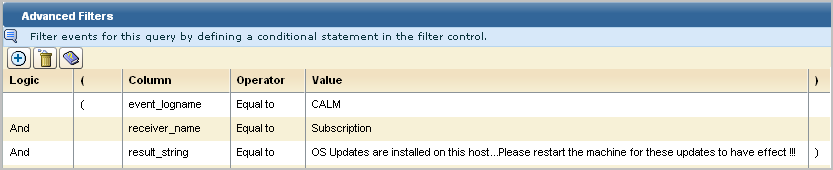
For example, a self-monitoring event is generated when a module requiring you to restart the operating system is downloaded in a subscription update. This self-monitoring event is generated only once. You may want to create an alert as a reminder to restart the operating system, in the event this self-monitoring event is overlooked.
Use the following example as a guide.
The query design wizard appears with the Details step selected.
The new alert appears in the Query Lists under the User folder.
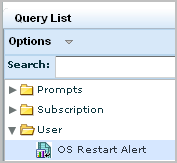
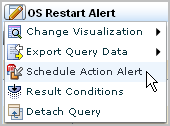
The Schedule Action Alerts wizard appears with the Alert Selection step displayed. OS Restart Alert is preselected under Selected Queries.
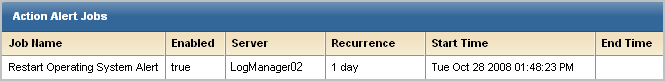
The Action Alert Job appears on the Alert Management tab, Alert Scheduling subtab.
Administrators need to be notified when any connector on any agent stops collecting events. You can automate this notification when an indicator suggests that this has occurred. You can configure the indicator, which is the elapsed time since a collection server has received events from any connector. You can set the elapsed time to the desired number of minutes, hours, or days. You can extend the query to all collection servers in the federation.
To limit the number of emails sent when a connector goes down, consider only those connectors that have been collecting events up until now. For example, set the alert to return rows only for connectors that did collect events during the hour before this one but did not collect events during the last hour.
To capture this data, select the predefined query, Collection Monitor by Log Manager Agent Connector Down. This query returns the connector name and the agent name when no events are received as defined in Result Conditions in the alert. Use the following example as a guide to generate an alert when no events are received during the last hour from a connector that sent events during the period between one and two hours ago. For the alert destination, specify the email address of the individual to notify. For the schedule to run the query, specify a frequency greater or equal to that of the elapsed time period.
Note: Email Settings must be configured under Administration, Report Server before creating the alert.
To email the Administrator when a connector stops collecting events
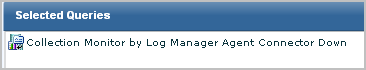
This sets the dynamic end time correctly to 'now', '-2 minutes'
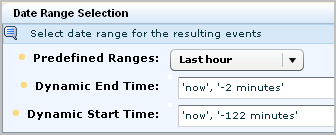
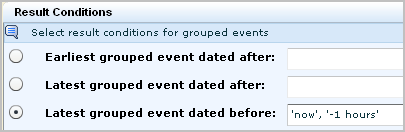
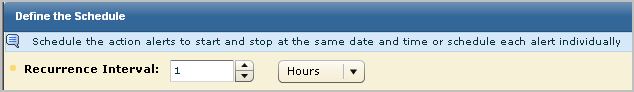
You could define this alert to query for the date range in days, rather than hours, and then schedule it to run once a day. In this case dynamic end time would be set to 'now', dynamic start time would be set to 'now', '-2 days', and latest grouped event dated before would be set to 'now', '-1 days'.
You can control how many action alerts are saved by the report server, and how long they are retained.
To configure action alert retention
The Service List appears.
The Report Server configuration pane appears.
Note: Action Alerts are deleted whenever either threshold is exceeded.
You can create a custom query with the Business_Critical_Sources keyed list and schedule an alert based on this query. The keyed list is one that has no default values and no associated predefined query or alert. Use the following end-to-end process as a guide.
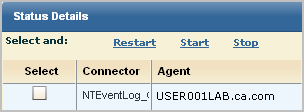
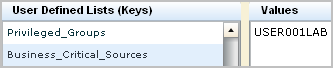
The Query Design wizard opens with the name Copy of Unsuccessful Login Attempts by Host.
Rename to query to Unsuccessful Login Attempts by Business_Critical_Sources.
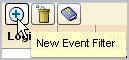
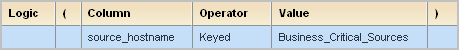
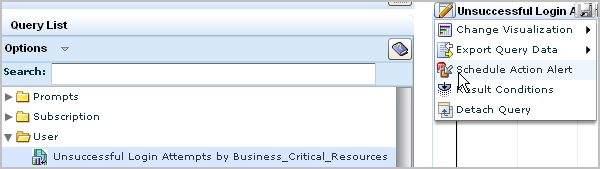
The Schedule Action Alerts wizard appears.
You can edit an existing Action Alert.
To edit an action alert
The Alert Server list appears.
The server details pane appears, showing the Generated Reports tab by default.
The Schedule Action Alerts wizard appears
The edited Action Alert appears in the Action Alerts list.
You can disable one or more action alerts when you no longer want the scheduled queries associated with that action alert to run. You can enable action alerts that were previously disabled, so that they run according to the saved schedule.
To disable or enable an action alert job
The Action Alert Jobs list appears, showing the status of each job in the Enabled column. If the job is enabled, the Enabled value is true. If it is disabled, the Enabled value is false.
The Action Alert Jobs list displays the new status of all the jobs you enable or disable.
Note: The ability to disable alert jobs is designed for use with recurring alerts. If you disable an alert job with a single occurrence ("Once") it is removed from the Action Alert Jobs list.
You can delete an unneeded Action Alert.
To delete an action alert
The Alert Server list appears.
The server details pane appears.
Note: The check boxes beside each alert job are used for enabling or disabling alert jobs.
A confirmation dialog appears.
A deletion successful message appears
The alert job is removed from the Alert Jobs list.
|
Copyright © 2014 CA Technologies.
All rights reserved.
|
|