

This section contains the following topics:
Exporting and Importing Query Definitions
Example: Create a Report from Existing Queries
Example: Set Up Federation and Federated Reports
Preparing to Use Reports with Keyed Lists
View a Report Using a Keyed List
You can use queries in the following ways:
There are two types of queries and reports:
CA User Activity Reporting Module offers a comprehensive list of queries and reports by subscription. If you are assigned a role of Auditor, Analyst, or Administrator, you can view all Subscription queries and reports. In addition, you can take the following actions on any subscription query or report you are viewing:
Only users who are assigned a role of Analyst or Administrator can take the following actions:
Example of Queries and Related Report
Consider the query tag Firewall Activity by DMZ. Notice that it is associated with six separate queries on this topic.
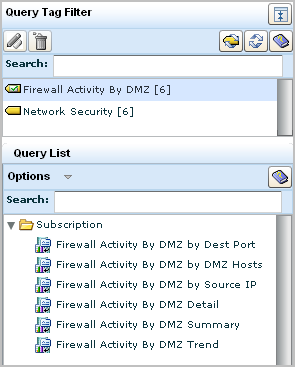
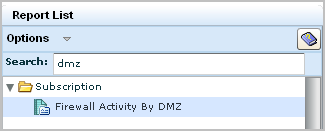
The queries you view on the query list are used in reports. From the Reports tab, you can display a report called Firewall Activity By DMZ.
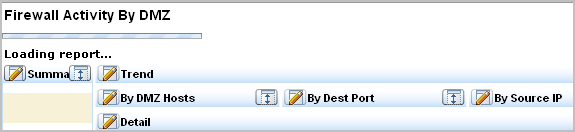
The following illustration shows just the names. Notice that each name reflects one of the six queries in the report. Most reports include query results for summary, trend, and detail.
Tags let you attach your reports and queries to categories for easy reference, and provide an organizational framework for reporting on your environment. Category tags also allow simple division of labor by role or type of event.
You can use the pre-defined tags or create your own custom tags for reports or queries. For example, you can create a "Monthly" tag to add to any reports you want to schedule every month for easy reference and viewing. This lets you add or remove reports from the report jobs without editing the jobs themselves, by simply adding the Monthly tag to a new job, or removing it from an old one.
You can add custom tags for individual queries or reports as part of the query or report creation or editing process. Once you create a new tag, its title appears in the tag list, and you can select it to add it to other reports or queries.
You can rename or delete custom tags. You can remove custom tags from reports or queries that include them by editing the report or query.
CA User Activity Reporting Module uses different locale properties files to display UI content of a locale. CA User Activity Reporting Module provides the following locale files in the /opt/CA/LogManager/locale directory:
These locale properties files are updated through releases, service packs, and subscriptions. You can use these locale properties files to change the default datetime format to a datetime format of your choice. The configured datetime format is displayed on the UI, query and report results.
CA User Activity Reporting Module supports the following datetime formats:
|
Pattern Letter |
Description |
|---|---|
|
Y |
Indicates a year. The following are the possible values:
If the pattern letter number is two, the value is interpreted as two digits. For example, YY=11 for the year 2011. If the pattern letter number is four, the value is interpreted as four digits. For example, YYYY=2011. |
|
M |
Indicates a month in the year. The following are the possible values:
If the pattern letter number is one, the value is interpreted as one or two digits. For example, M=1 or 11. If the pattern letter number is two, the value is interpreted as two digits. For example, MM=01. If the pattern letter number is three, the value is interpreted as three letters. For example, MMM=Jan. If the pattern letter number is four, the value is interpreted as full text. For example, MMMM=January. |
|
D |
Indicates a day in the month. The following are the possible values:
If the pattern letter number is one, the value is interpreted as one or two digits. For example, D=1 or 11. If the pattern letter number is two, the value is interpreted as two digits. For example, DD=01 or 11. |
|
E |
Indicates a day in a week. The following are the possible values:
If the pattern letter number is three, the value is interpreted as three letters. For example, EEE=Mon. If the pattern letter number is four, the value is interpreted as full text. For example, EEEE=Monday. |
|
A |
Indicates a time format. The following are the possible values:
|
|
J |
Indicates the hour on a 24-hour clock in the range 0–23. |
|
H |
Indicates the hour on a 24-hour clock in the range 1–24. |
|
K |
Indicates the hour on a 12-hour clock in the range 0–11. |
|
L |
Indicates the hour on a 12-hour clock in the range 1–12. |
|
N |
Indicates a minute in the hour. The following are the possible values:
If the pattern letter number is one, the value is interpreted as one or two digits. For example, N=1 or 11. If the pattern letter number is two, the value is interpreted as two digits. For example, NN=01 or 11. |
|
S |
Indicates a second in the minute. The following is the possible value:
If the pattern letter number is two, the value is interpreted as two digits. For example, SS=01 or 11. |
|
Q |
Indicates a millisecond in the second. The following are the possible values:
If the pattern letter number is two, the value is interpreted as two digits. For example, QQ=01 or 11. If the pattern letter number is three, the value is interpreted as three digits. For example, QQQ=001. |
For example, if the current date is February 11, 2011 and the current time is 14.20.12 PM on a 24-hour clock, the datetime can be of the following formats:
You can perform the following steps to change the datetime format:
Note: The name of a locale properties file must match the language name displayed in the browser language settings.
Note: You must update a locale properties file that you created with the latest content of the corresponding locale properties file provided by CA User Activity Reporting Module. You can customize the file after the update.
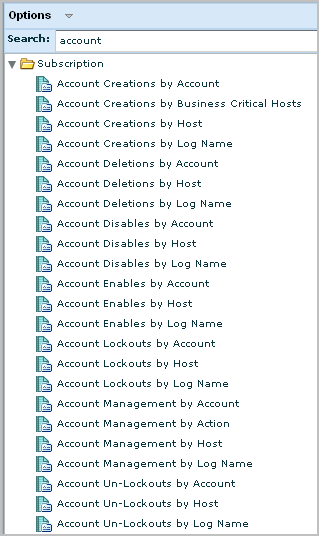
All users who are assigned a role of Auditor, Analyst, or Administrator can view all queries. Predefined queries are listed under the Subscription folder. When the first custom query is defined, a User folder is added to the query list to hold the custom query. After that, all custom queries are added to this User folder.
To view a query
The Query Tag Filter maximize button, the Query List, and Options menu and a Search text box appear in the left pane.
The selected query appears in the details pane in table format. The most recent results appear first in the results table. To view additional results, click the arrow keys or select a range of rows from the list.
Note: If the query results are not grouped, the list displays the row ranges you have viewed, and the next sequential range available. If the query results have been grouped, the list displays all rows ranges available in the entire results set.
All users who are assigned a role of Auditor, Analyst, or Administrator can view all reports. Predefined reports are listed under the Subscription folder. When the first custom report is defined, a User folder is added to the report list to hold the custom report. After that, all custom reports are added to this User folder.
Selecting a report from the report list runs the queries that make up the report on log records currently residing in the internal event log stores. The report results, displayed on the right pane, are from the event log stores of the active CA User Activity Reporting Module server and its child servers.
To view a report
The Report Tag Filter maximize button, a Search entry field, the Report List, and the Options menu appear in the left pane.
This lets you display any selected report in the right pane.
The selected report displays in the main pane of the page.
You can set your report list so that you can make changes without loading reports. Normally, selecting a report from the list displays it in the details window.
Disabling this default mode saves time by letting you select a report from the list and edit it immediately, without waiting for it to display. This is especially useful if you have multiple reports to edit and already know what changes you plan to make.
Since only users with the Administrator or Analyst mode can create or edit reports, only these users can disable the show selected report setting.
To disable show selected report
The Options menu appears.
Any report selected from the list is not displayed until Show Selected Report is re-enabled.
The PCI Security Standards Council is an open global forum responsible for the development of the PCI Data Security Standard (PCI DSS) that includes requirements for security management, policies and procedures. Organizations that store, process or transmit cardholder data must comply with PCI DSS version 1.2, which details twelve requirements.
CA User Activity Reporting Module provides out-of-the-box PCI reports that you can view as soon as your system begins to collect and process event logs.
The examples in this section help you become familiar with the PCI reports and how to schedule and distribute them. The examples include references to the number associated with the PCI DDS Requirement that the report addresses.
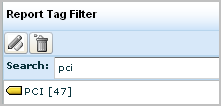
You can begin your assessment of how to use CA User Activity Reporting Module reports to demonstrate PCI compliance by viewing the list of predefined reports that are tagged with the PCI tag.
To become familiar with reports with the PCI tag
The Report Tag Filter and Report List appear.
The PCI tag appears.
You can search for predefined reports using keywords relevant to specific PCI DDS controls. The following procedure covers a few examples.
Note: The referenced numbers are the number associated with the PCI DDS Requirement that the report addresses.
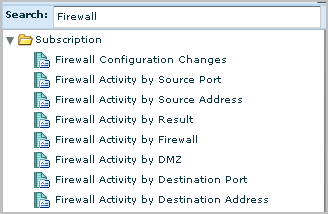
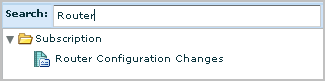
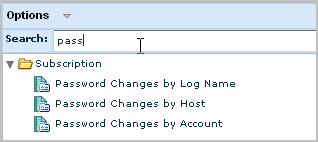
To display the list of reports relevant to specific PCI DDS controls
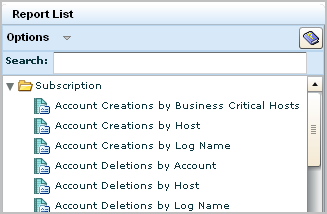
A list of reports similar to the following appears. Notice the one titled Firewall Configuration Changes.
You can work with any report, including PCI reports, in the following ways:
To view or act on a selected report
The resulting report displays the results of the underlying queries, which typically include a summary, the trend, and details, as well as report-specific queries.
When the Print dialog displays, select a printer and click Print.
The Schedule Report wizard appears with the displayed report in the Selected Reports area.
If you accept all defaults, the job is scheduled to run now with no recurrence, where the report is generated in PDF format with no email notification. The data is drawn from the current server, its federated peers and its federated descendants.
The job you just scheduled is shown.

A prompt is a special type of query that displays results based on the value you enter and the CEG fields you select. Rows are returned only for events where the value you enter appears in one or more of the selected CEG fields.
You can take any of the following actions on prompt query results:
Each connector that is configured on an agent collects raw events from a specific event source and sends the events to the event log store on a CA User Activity Reporting Module collection server. The event refinement process converts raw events to refined events and archives them to the reporting CA User Activity Reporting Module server. The connector prompt queries for events on the reporting server that were collected as raw events by connectors with the name you specify. Connectors can have a default name or a user-defined name. You copy the name of the connector to use and paste it in the field of the connector prompt and click Go to display the prompt query results.
Use the connector prompt to:
To copy the name of an active connector
The Log Collection Explorer is displayed.
The Agent Status Monitor appears, where one column lists connector names.
To use the Connector prompt
The Query List displays the Prompts folder, the Subscription folder, and possibly a Users folder.
The Connector prompt displays the Connector field and the following CEG field, which must remain selected for the prompt to function:
Is the name of a connector.
The connector name you copied from the Agent Status Monitor appears in the Connector field.
Results of the connector prompt query appear.
Indicates the severity of the event, where the values in increasing order of severity include: Information, Warning, Minor Impact, Major Impact, Critical, and Fatal.
Indicates when the event occurred.
Identifies the high-level category of the corresponding event action. For example, System Access is the category for the Authentication action.
Identifies the action, where possible actions are determined by the class of the event.
Identifies the agent on which the connector is running.
Identifies the event source host from which the connector is collecting events.
Identifies the source actor of the event, that is, the identity that initiated the action. The performer can be expressed as the source username or source process name.
Identifies the username of the account used for authentication when the connector attempts to connect to the host with the event source from which raw events are collected. This is typically a low-privileged account. The credentials for this account are configured on the event source and also on the log sensor of the connector.
Specifies a code for the event result of the corresponding action, where S means Success, F means Failure, A means Accepted, D means Dropped, R means Rejected, and U means Unknown.
The name of the connector entered in the prompt filter field.
The first event collected by a new connector is for the action System Startup and ends with: result_string=<connector name> Connector Started Successfully
The host prompt queries for events where the hostname you specify appears in the selected CEG fields of the refined event. When raw event data is refined, event details can include several different CEG host names. Consider this scenario:
Note: Source_hostname and dest_hostname can be different hosts or the same host.
Note: Event_source_name can be a different host than either source_hostname or dest_hostname or can be colocated.
Note: Agent_hostname is the same as event_source_name in agent-based log collection but is different in agentless and direct log collection.
To use the Host prompt
The Query List displays the Prompts folder and one or more folders for other queries.
The Host prompt appears.
Is the name of the host where the event action was initiated.
Is the name of a host that is the destination or target of the action.
Is the name of a host that records the event when the event occurs.
For example, you can deploy a connector based on WinRM to collect events from the Event Viewer on a Windows Server 2008 host. To select events retrieved from a given Windows Server 2008 host, enter the hostname of that server and select this field.
Is the same as agent_hostname.
Is the name of the host where a CA User Activity Reporting Module agent is deployed.
Results of the host prompt query appear.
Indicates the severity of the event, where the values in increasing order of severity include: Information, Warning, Minor Impact, Major Impact, Critical, and Fatal.
Indicates when the event occurred.
Identifies the name of the user on source_hostname who initiated the event action.
Specifies a code for the event result of the corresponding action, where S means Success, F means Failure, A means Accepted, D means Dropped, R means Rejected, and U means Unknown.
Identifies the name of the host where the CA User Activity Reporting Module agent who collected the event is installed.
The same as agent host.
Identifies the high-level category of the corresponding event action. For example, System Access is the category for the Authentication action.
Identifies the event action performed by the source user.
Identifies the log name used by the connector that collected the event. All connectors based on the same integration transmit events in a log file with the same log name.
The IP prompt queries for events where the IP address you specify appears in the selected CEG fields of the refined event. When raw event data is refined, event details can include several different CEG IP addresses. Consider this scenario:
Note: Source_address and dest_address can be different or the same.
Note: Event_source_address can be different from either source_address or dest_address or can be the same as one or both.
Note: Agent_address is the same as event_source_address in agent-based log collection but is different in agentless and direct log collection.
To use the IP prompt
The Query List displays the Prompts folder and one or more folders for other queries.
The IP prompt appears.
Is the IP address of the host where the action was initiated.
Is the IP address of a host that is the destination or target of the action.
Is the IP address of a host that records the raw event when the event occurs.
For example, you can deploy a connector based on WinRM to collect events from the Event Viewer on a Windows Server 2008 host. To select events retrieved from a given Windows Server 2008 host, enter the IP address of that server and select this field.
Is the same as agent_address.
Is the IP address of a host where a CA User Activity Reporting Module agent is deployed.
Results of the IP prompt query appear.
Indicates the severity of the event, where the values in increasing order of severity include: Information, Warning, Minor Impact, Major Impact, Critical, and Fatal.
Indicates when the event occurred.
Provides a code for the result of the corresponding action, where the displayed letter has the following meaning: S for success, F for failure, A for Accepted, D for Dropped, R for Rejected, and U for Unknown.
Identifies the communication port on the destination host, the target of the event action.
Identifies the IP address from which the event action was initiated.
Identifies the IP address of the host that was the target of the event action.
Identifies the IP address of the host with the repository where the event was originally recorded.
Identifies the name of the host with the CA User Activity Reporting Module agent responsible for the collection of events from the event source.
The same as Agent IP.
Identifies the high-level category of the corresponding event action. For example, System Access is the category for the Authentication action.
Identifies the event action.
Identifies the log name used by the connector that collected the event
Each connector that is based on the same integration returns event logs collected from the event source to the CA User Activity Reporting Module collection server in a log file with a predefined name.The log name prompt queries for events involving the log name you specify.
Use the log name prompt to query for events transferred in a log file with the specified name. Each connector is based on an integration. Each integration uses a predefined log name. A query for a given log name returns results of events collected by different agents that use connectors based on the same integration or similar integrations.
A variety of conventions are used for naming logs:
Some log names are reused as new releases or platforms are added. For example, NT-Security is the log name for security logs for the following integrations: NTEventLog, Windows2k8, and WinRM.
To use the Log Name prompt
The Query List displays the Prompts folder and one or more folders for other queries.
The Log name prompt filter appears with the following field:
Is the name of a log file associated with a specific integration.
Results of the log name prompt query appear.
Indicates the severity of the event, where the values in increasing order of severity include: Information, Warning, Minor Impact, Major Impact, Critical, and Fatal.
Indicates when the event occurred.
Identifies the high-level category of the corresponding event action. For example, System Access is the category for the Authentication action.
Identifies the event action performed by the corresponding performer.
Identifies the event source host from which the connector is collecting events.
Identifies the source actor of the event, that is, the identity that initiated the action. The performer can be expressed as the source username or source process name.
Identifies the username of the account used for authentication. When the connector attempts a connection to the event source, authentication occurs. Authentication typically uses a low-privileged account. During connector deployment, the administrator configures credentials for this account on the event source and then identifies this account on the log sensor.
Specifies a code for the event result of the corresponding action, where S means Success, F means Failure, A means Accepted, D means Dropped, R means Rejected, and U means Unknown.
The log name entered in the prompt filter field.
The port prompt queries for events where the port you specify appears in the selected CEG fields of the refined event. When raw event data is refined, event details can include several different CEG port numbers. Consider this scenario:
Note: Source_port and dest_port are the same for local events. Otherwise, they are host-specific.
Note: The agent uses port 17001, by default, to secure communications to the CA User Activity Reporting Module collection server.
To use the Port prompt
The Query List displays the Prompts folder and one or more folders for other queries.
The Port prompt appears.
Is the communications port used for initiating the action.
Is the communication port on the destination host that is the target of the action.
Is the port that the agent uses to communicate with the CA User Activity Reporting Module collection server.
Results of the port prompt query appear.
Indicates the severity of the event, where the values in increasing order of severity include: Information, Warning, Minor Impact, Major Impact, Critical, and Fatal.
Indicates when the event occurred.
Identifies the IP address of the host from which the event action was initiated.
Specifies a code for the event result of the corresponding action, where S means Success, F means Failure, A means Accepted, D means Dropped, R means Rejected, and U means Unknown.
Identifies the outbound port used for initiating the action.
Identifies the inbound port on the destination host.
Identifies the outbound port on the agent used to send event logs to the CA User Activity Reporting Module server.
Identifies the high-level category of the corresponding event action. For example, System Access is the category for the Authentication action.
Identifies the event action.
Identifies the log name used by the connector that collected the event.
Each event expresses information about two actors: the Source and the Destination.
The source actor can be a user, source_username, or a process, source_processname.
The destination actor can be a user, dest_username, or an object, dest_objectname.
The User prompt queries for events where the actor you specify appears in the selected CEG fields of the refined event. Consider this scenario:
To use the User prompt
The Query List displays the Prompts folder and one or more folders for other queries.
The User prompt appears.
Is the name of the user that initiated the event action.
Is the name of user that is the target of the action.
Is the name of the object involved in the action referenced in event information.
Is the name of the object that is the target of the action.
Results of the User prompt query appear.
Indicates the severity of the event, where the values in increasing order of severity include: Information, Warning, Minor Impact, Major Impact, Critical, and Fatal.
Indicates when the event occurred.
Identifies the name of the host with the user who was the target of the event action.
Specifies a code for the event result of the corresponding action, where S means Success, F means Failure, A means Accepted, D means Dropped, R means Rejected, and U means Unknown.
Identifies the user who initiated the event action.
Identifies the object on the source host that was involved in the event action.
Identifies the user who was the target of the event action.
Identifies the object on the destination host that was involved in the event action.
Identifies the high-level category of the corresponding event action. For example, System Access is the category for the Authentication action.
Identifies the event action.
Identifies the log name used by the connector that collected the event.
You can create custom queries using the Query Design wizard. When you create a query you must choose whether it applies to the event database, the incident database, or to an external ODBC database. The event database stores information on all the events received by that server. The incident database stores information on incidents and elements of their component events as specified by correlation rules.
You can delete custom queries and export query information. You can also copy a subscription query to create a custom query and edit that query using the query design wizard. Only users with the Administrator or Analyst roles can create, delete, or edit queries.
Creating a query using the query design wizard involves the following steps:
To create a new custom query, create a copy of a query, or edit an existing query, you must open the query design wizard.
To open the query design wizard
The Query List appears.
The query design wizard appears.
When using the wizard:
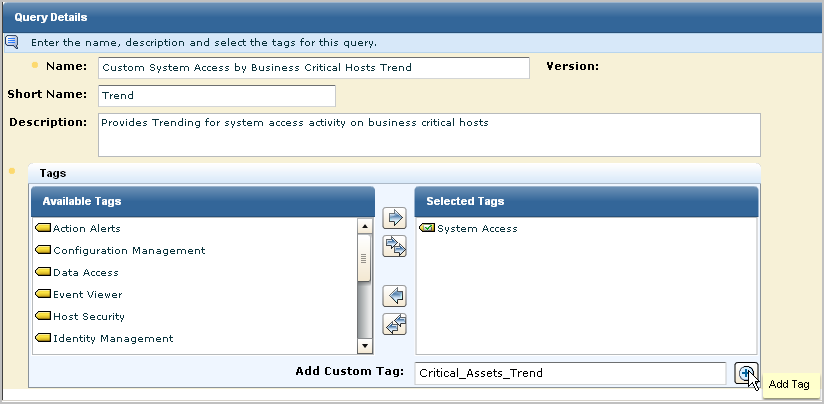
The first step in creating a query is entering identifying information and setting any tags you want to include.
To add a new query
Targets your query to the internal event or incident databases.
Targets your query to an external ODBC table you select. The Table drop-down list is populated with any views in your target database.
If you selected UARM Default, select one of the following:
Applies the query to the event database, which stores all raw and refined event information received by the current server, or available through federation.
Applies the query to the incident database, which stores incidents created by the event correlation system, and the event information used to create those incidents. Correlation rules control the specific components of an event that are used to create an incident.
If you selected Custom Connection, choose the ODBC table you want. The list is populated with tables from the ODBC connection you selected.
Note: We recommend using this field for information about the query structure. For example, it could contain an explanation of why the query contains certain fields and function.
The custom Tag appears, already selected, in the Tags shuttle control.
Note: If you delete one of the custom nested tags, all the custom tags in which it is nested are also deleted, including the parent tag. If you nest a custom tag inside a subscription tag, and then delete it, only the custom tags are deleted.
When you complete the process, the new tags appear in the list, with the nested custom tags visible when you expand the parent tag.
If you click Save and Close, the new query appears in the Query List, otherwise the query design step you choose appears.
To create a query against the incident or event databases, write a SQL statement that retrieves the event information you want from the event log store. The query design wizard helps automate this process.
To create a query SQL statement
Lets you enter a different name for the column, when it is displayed in Table or Event Viewer format. If you enter no Display Name, the native field name is used as the column name, "event_count" for example.
Lets you apply one of the following SQL functions to the column values:
Each CEG field belongs to one of three types; string, integer, or datetime. When you add a CEG field to a query, CA User Activity Reporting Module makes functions that apply to its type available. For example, if you select ideal_model, only those functions that apply to string values appear.
Sets the query display to show the selected columns grouped by the selected attribute. For example, you can set the query to group events by source name. You can control the order in which it is applied to various columns. If the first column values are identical, the second are applied. For example, you can group multiple events from the same source by username.
Controls the order in which the selected value is sorted. You can control the order in which it is applied to various columns. If the first column values are identical, the second are applied.
Sets the column values to display in descending order (highest to lowest value) rather than the default ascending order.
Controls whether the row is displayed in a table or Event Viewer if it contains no value. Selecting the Not Null check box removes the row from the query result if it contains no displayable value.
Controls whether the column is visible in a table or Event Viewer format. You can use this setting to make the column data available in the details view without showing it in the display itself.
Note: If you select a Function other than TRIM, TOLOWER, TOUPPER or a Group Order setting for a column, you must also select the same setting for other columns. Otherwise, CA User Activity Reporting Module displays error messages.
If you click Save and Close, the new query appears in the Query List, otherwise the Query Design step you choose appears.
To create a query, write a statement that retrieves the event information you want from the target ODBC database. The query design wizard helps automate this process.
Follow these steps:
Lets you enter a different name for the column, when it is displayed in Table or Event Viewer format. If you enter no Display Name, the native field name is used as the column name.
Lets you apply a function to the column values. Each field belongs to one of three types; string, integer, or datetime. When you add a column to a query, CA User Activity Reporting Module displays only those functions that apply to its type.
Sets the query display to show the selected columns grouped by the selected attribute. For example, you can set the query to group events by source name. You can control the order in which it is applied to various columns. If the first column values are identical, the second are applied. For example, you can group multiple events from the same source by username.
Controls the order in which the selected value is sorted. You can control the order in which it is applied to various columns. If the first column values are identical, the second are applied.
Sets the column values to display in descending order (highest to lowest value).
Controls whether the row is displayed in a table or Event Viewer if it contains no value. Selecting the Not Null check box removes the row from the query result if it contains no displayable value.
Controls whether the column is displayed in a table or Event Viewer. You can use this setting to make the column data available in the details view without showing it in the display itself.
Note: If you select any function other than TRIM, TOLOWER, TOUPPER or a Group Order setting for a column, you must also select the same setting for other columns. Otherwise, CA User Activity Reporting Module displays error messages.
If you click Save and Close, the new query appears in the Query List. Otherwise the Query Design step you choose appears.
You can filter the information returned by your query using simple or advanced filters. Simple filters let you create single-term filter statements easily and apply them to the default CA User Activity Reporting Module databases. Advanced filters let you build more complex statements, including nested statements. You can apply advanced filters to either internal queries or external ODBC queries.
To set query filters
The query filters dialog appears, displaying the Simple Filters Tab.
Note: Simple filters are not available if you select a custom connection when creating a query. Use advanced filters to qualify a custom ODBC query.
If you click Save and Close, the new query appears in the Query List, otherwise the Query Design step you select appears.
You can create simple filters to set search parameters for common values. For example, you could set the Ideal Model field to "Content Management" to identify all events with that value in the Ideal Model CEG field. Simple filters are used by many features, including event and incident queries, suppression and summarization rules, and event forwarding rules.
To create a simple filter
Advanced filters are used by many features, including query creation, report scheduling,alert jobs, and local and global filters.
To create an advanced filter
The first row of the event filter table becomes active, and its Logic and Operator columns are populated with the default values "And" and "Equal to" respectively.
You can use advanced filters to qualify any function that queries databases, including narrowing queries, or adding additional qualifications to simple filters. The Advanced Filters interface provides a form for entering logic columns, operators and values according to your filtering requirements.
Note: This section contains a brief overview of the terms used in advanced filters. To use advanced filters to their full potential you need a thorough understanding of the terms and the Common Event Grammar.
The following terms join multiple filter statements:
Displays the event information if all the joined terms are true.
Displays the event information if any of the joined terms are true.
Refines the terms of the main query statement by adding a qualifying statement. For example, you could set an advanced filter and add a "having" statement to return only events of a certain severity level from the specified hosts.
Advanced filters use the following operators to create the basic conditions:
Include the event information if the column bears the appropriate relation to the value you enter. The following relational operators are available:
For example, using Greater than would include the event information from your chosen column if its value is greater than the value you set.
Includes the event information if the column contains a pattern you enter, using % to set the pattern you want. For example, L% would return any values beginning with L, %L% would return any values where L is not the first or last letter.
Includes the event information if the column does not contain the pattern you specify.
Includes the event information if the column contains one or more of the values in the quote-delineated set you enter. Multiple values in the set must be comma-separated.
Includes the event information if the column does not contain one or more of the values in the quote-delineated set you enter. Multiple values in the set must be comma-separated.
Includes any event information that matches one or more of the characters that you enter, allowing you to search for key words. Matches is not available for ODBC queries.
Includes any event information that is set as a key value during Report Server configuration. You can use key values to set business relevance or other organizational groups.
Includes any event information that is not set as a key value during Report Server configuration. You can use key values to set business relevance or other organizational groups.
You can set a date range and other result conditions for the query, including row limits and base display time period. You can change result conditions at any time, making them a useful way to modify queries without altering the base query or its filters.
If you are creating a scheduled report or action alert, you can set result conditions for both event and incident queries that make up the jobs.
You can set the following types of result conditions:
Note: If you do not group at least one column when creating a query, users are unable to edit result conditions from the query display.
You can set a time or date range condition for your query. This improves the efficiency of your query by narrowing the portion of the event log store it must search.
You can use a predefined time range, or create a custom time range. You must set both a beginning and an end time for a custom time range. If you only set a single time parameter, it is expressed as a "Where" clause.
To set result conditions
Note: If you are creating an action alert or scheduled report, the interface displays the following default time ranges:
The Dynamic Time Specification dialog appears.
The Dynamic Time Specification dialog closes, and the values you selected appear in the 'Dynamic End Time' area. If you use multiple parameters, they form a complete time statement, with each parameter referring to the first. For example, adding the 'Start of the Month,' and 'Day of the Week - Tuesday' values in the 'Dynamic End Time' area ends your query on the first Tuesday of the month.
Note: When you use 'Number of' values, such as 'Number of days' or Number of hours' enter a negative number to set a time in the past. Using a positive number sets a future end time, and causes the query to continue sending results as long as at least one qualified event is in the log store.
For example, adding the 'now,' and 'number of minutes -10' values to the 'Dynamic Start Time' area starts your query 10 minutes before the selected end time.
If you do not enter a date range, the query is applied all events in the log store. If you enter an invalid date range, your query might not return any results.
If you click Save and Close the new query appears in the Query List, otherwise the Query Design step you choose appears.
You can set conditions that allow you to control the query display and conditions that search for events based on how they are grouped. If you are setting conditions for a custom ODBC query, only the Row Limit and No Limit options are available.
To set display and group conditions
This value is only available for Action Alerts and Report Scheduling. It sets the alert or report job to use the row limit of the individual queries in the job. If you select any other results value when creating a job, CA User Activity Reporting Module overrides the row limits in the component queries.
Sets the maximum number of event rows that the query displays, starting with the most recent events.
Sets the query to retrieve all events that match its filter. This can include many events, so plan the query accordingly.
Indicates the presence of other results that are not displayed due to the row limit. This value allows you to compare the selected events in the context of all events of that type. For example, if you choose a row limit of 10 for your event viewer display and select show other, events beyond 10 are displayed as a single entry titled Other, showing all remaining events. This setting is only effective when row limit is selected.
Sets the detail level of the time period field used in the query display.
The group conditions use the same time statement system as the time range fields.
If you click Save and Close the new query appears in the Query List, otherwise the Query Design step you choose appears.
To create a new query display you must set the Visualization details that control how the event information appears.
To create a query display visualization
If you choose Event Viewer, the visualization step is complete. The event columns appear in the Event Viewer display in the order in which you placed them during the Query Columns construction step.
Note: Table is always available as a visualization even if you do not add it during this step.
If you click Save and Close the new query appears in the Query List, otherwise the Query Design step you choose appears.
You can add one or more drill down reports to your query. Drill down reports let users click a query display element and display another related report.
To add a drill down report
If you click Save and Close the new query appears in the Query List, otherwise the Query Design step you choose appears.
You can edit existing custom queries. You cannot edit a subscription query; however, you can copy a subscription query and edit your copy. If you edit a query, the changes you make affect any reports using that query.
To edit a query
The Query Tag Filter list and the Query List appear.
The query design wizard appears, populated with the specifications of the query you selected.
You can delete a custom query. You cannot delete a subscription query.
To delete a query
A confirmation dialog appears.
The deleted query is removed from the Query List.
You can set your query list so that you can make changes without loading queries. Normally, selecting a query from the list displays it in the details window.
Disabling this default mode saves time by letting you select a query from the list and edit it immediately, without waiting for it to display. This is especially useful if you have multiple queries to edit and already know what changes you plan to make.
Note: Because only users with the Administrator or Analyst mode can create or edit queries, only these users can disable the show selected query setting.
To disable show selected query
The Options menu appears.
Any query selected from the list is not displayed until Show Selected Query is re-enabled.
You can export and import details of custom queries for use in other management servers. This lets you transfer successful custom queries between CA User Activity Reporting Module environments, or from a test to a live environment.
You can export the details of user-created queries for use in other management servers. The export is saved as an XML file.
To export query details
The Query List appears.
The Export User Query Definitions dialog appears, displaying available user-created reports.
An export dialog appears.
The query files are saved to your chosen location and a confirmation dialog appears.
The Export User Query Definitions dialog closes.
You can import query definition XML files for use in the local management server.
To import report details
The Query List appears.
The Import File dialog opens
The Import Results window appears.
The Import Results window closes.
You can create custom reports for your environment, either by using the process outlined in this section to create an entirely new report, or by using a pre-defined report as a template. You can view custom reports or set them as scheduled report templates.
You can also edit or delete custom reports, and export report information. You can perform these customization tasks only if you are logged in as a user with the Administrator or Analyst roles.
The process of creating a new report using the report design wizard has the following steps:
To create a new custom report from scratch or based on an existing report, you must open the report design wizard.
To open the report design wizard
The Reports List appears.
The Report Design wizard appears.
When using the wizard:
You can create a report from scratch or from a copy of an existing report. When you create a report, you name it and add any subscription or custom tags you want to associate with it.
To add report details
Targets your report to the internal event and incident databases.
Targets your report to an external ODBC table you select. To complete a report, you must have configured custom ODBC queries that target your chosen database.
The custom Tag appears as in the Selected Tags list.
Note: If you delete one of the custom nested tags, all the tags in which it is nested are also deleted, including the parent tag. If you nest a custom tag inside a subscription tag, and then delete it, only the custom tags are deleted.
When you complete the process, the new tags appear in the list, with the nested custom tags visible when you expand the parent tag.
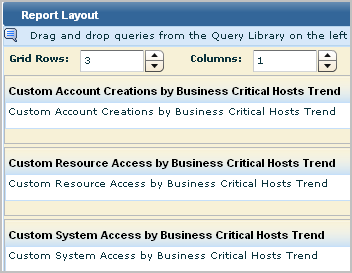
You can design your report structure by specifying the grid size and dimensions and then selecting queries to display in each grid section. A report can contain either internal CA User Activity Reporting Module queries, or queries directed to an external ODBC database, but not both.
To design a report layout
The appropriate number of rows, columns, and corresponding query displays appears in the report layout pane.
Note: You can use the arrows at the right side and bottom of individual query display areas to expand or shrink them horizontally or vertically.
The Report Design wizard closes. The new report appears in the Report List under the User folder.
You can create custom reports composed of predefined queries and tailor it to your specifications.
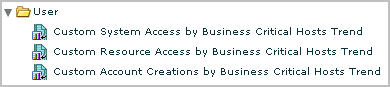
To create a report from existing queries
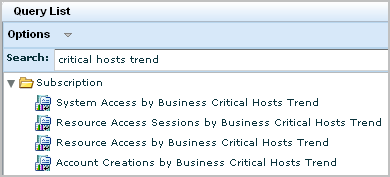
The copied queries display under User:
The Report Design wizard appears.
Add the custom tag, Critical_Assets_Trend.
Note: It is good practice to examine any new report to verify that it provides the desired information in the best possible way.
You can collect logs from high-volume, geographically separate data centers and set up reporting so that distributed data is queried from just one of the data centers.
Consider an example scenario where the two high-volume data centers are located in New York and Virginia, where New York is the corporate headquarters. Each data center has a collection server that collects and processes incoming event logs and sends them to its reporting server. The reporting server handles queries, alerts, and reports. Most queries, alerts, and reports target event data collected through agents; consolidating data from these event sources requires federation among reporting servers and collection servers.
Some queries, alerts, and reports target self-monitoring events generated by CA User Activity Reporting Module servers; consolidating this type of data requires inclusion of the management server in the federation. If consolidating self-monitoring event data is not desired, the management server can be excluded from the federation. Self-monitoring events from this server can be monitored with non-federated local reports. For simplicity, the management server is excluded in this federation; inclusion could be achieved by creating a meshed federation between the NY-Reporting-ELM and Management-ELM.
The server names are as follows:
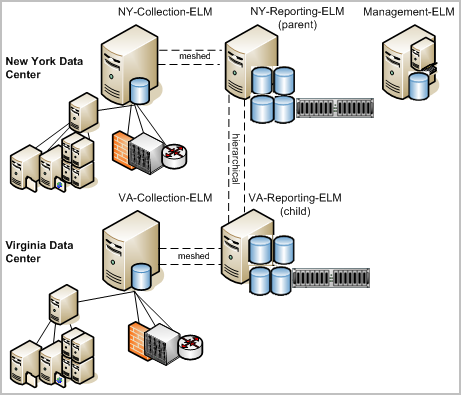
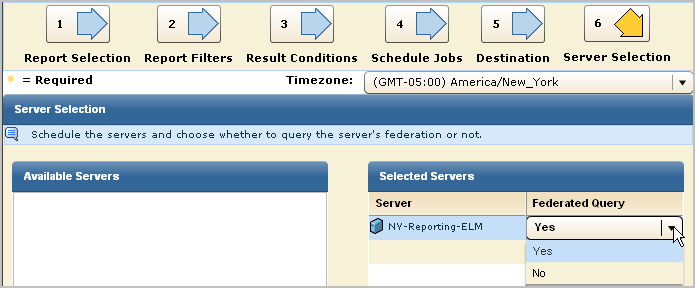
Assume the Administrator in New York wants all reports and alerts that are run from the New York site to include data from the Virginia site, but wants all reports and alerts run from the Virginia site to include only locally collected data.
The following example shows how to federate the servers and configure reporting to meet the criteria for this scenario. Procedures for configuring auto-archiving are not included in this example, but auto-archiving should be configured for any high-volume architecture.
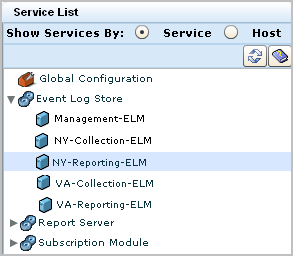
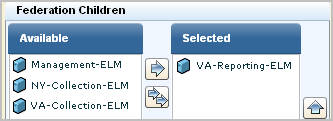
The resulting reports include data from NY-Reporting-ELM, its peer, NY-Collection-ELM, its child, VA-Reporting-ELM, and its child's peer, VA-Collection-ELM.
Note: A federated query run from VA-Reporting-ELM includes data from VA-Reporting-ELM and its peer VA-Collection-ELM. It does not include data from NY-Reporting-ELM, since this server is its parent in the hierarchical federation.
You can edit a custom report.
Note: You can disable the Show Selected Report option when editing multiple reports. This lets you select and edit reports without waiting for them to display in the details pane.
To edit a report
The Report Design wizard appears, populated with the specifications of the report you selected.
The edited report appears in the Report List under User folder.
You can delete a custom report. You cannot delete a subscription report.
To delete a custom report
A confirmation dialog appears.
The deleted report is removed from the Report List.
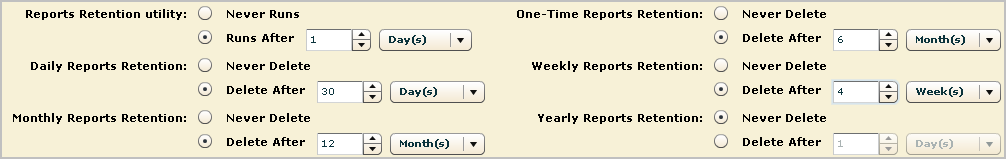
You can implement policies on report retention through the global configuration of report servers. You can set a different retention policy for each schedule report recurrence, that is,
You must change the default of Never Runs for the Reports Retention utility to a frequency. Be sure the frequency with which you set the utility to run is often enough to do the deletions at the frequency you configure. For example, if you want to delete your daily reports 1 day after they run, and you schedule daily reports to be run at 6 a.m. and 6 p.m., you would set the reports retention utility to run every 12 hours at the minimum.
Example: Delete all Daily Reports Older Than 30 Days
The Service List shows services by service.
The Global Service Configuration: Report Server appears.
You can export the details of user-created files for use in other management servers. The export is saved as an XML file. An exported report definition includes the definitions for all the queries in that report.
To export report details
The Report List appears.
The Export User Definitions dialog appears, displaying available user-created reports.
An export dialog appears.
The Report files are saved to your chosen location and a confirmation dialog appears.
The Export User Report Definitions dialog closes.
You can import report definition XML files for use in the local management server.
To import report details
The Report List appears.
An Import File dialog opens
The Import Results window appears.
The Import User Report and Query and Query Definitions window closes.
All reports are built from one or more queries. Some queries used in predefined reports are designed to select all values from a given table where a certain attribute field contains a value used as criteria for compiling the list of key values. For example, an assets table has an IsCritical field. A query that selects all asset names from the asset table where IsCritical equals Yes, would select only the names of critical assets. These names could be returned to CA User Activity Reporting Module to refresh the values for the Critical_Assets key.
Preparing to use predefined reports with keyed lists involves the following tasks:
In addition, you can add new keys for custom reports that use keyed lists and then add values for each new key. You can also add values to the Business_Critical_Sources key and the ELM_System_Lognames key for on demand queries of your own design.
The procedures required to enable dynamic values import apply only to CA IT PAM users.
If you use CA IT PAM and have existing tables or spreadsheets where you keep lists of files, databases, hosts, and users, for example, you can leverage this data. You can create a process that reads the table or file, selects the values pertinent to the key, and returns those values to the CA User Activity Reporting Module values list for that key.
To import dynamic values
Note: If any process reads a database table, install a CA IT PAM agent on the server with the SQL Server 2005 database.
A dynamic values process is a CA IT PAM process that you can invoke to populate or update the values list for a selected key that is used in reports or alerts. The assumption is that you are already storing master lists of the files, databases, hosts, users, and so forth that make up your work environment and that this master list is designed with attributes that allow you to query for sets of values of interest. If you use CA IT PAM, you can create processes that can be invoked to run the queries that return the data to CA User Activity Reporting Module for use as key values in the reports and alerts based on keys. Being able to dynamically create a values list is a useful way to keep volatile key list updated with current values.
You can create a process in CA IT PAM for each key values list that you want to be able to generate on demand. Use your CA IT PAM documentation for details on process creation. Each process must meet CA User Activity Reporting Module requirements regarding InputKey, the ValueList and FaultString local process parameters, and the Success and Failure calculation operators.
Use the following guidelines:
Note: CA User Activity Reporting Module requires these exact parameter names be used as output interface parameters.
If you create a script, consider these additional guidelines:
You can configure CA IT PAM integration to leverage either or both of the following types of CA IT PAM processes:
Configuration for either purpose requires the ability to launch and log in to CA IT PAM. Gather the following values:
Configuration of CA IT PAM for dynamic values lets you import the list of values that are dynamically generated by the configured dynamic values process. The import is done when setting up or refreshing keyed values used in certain reports and alerts.
The following procedure addresses both the common settings and the one specific to dynamic values.
To configure CA IT PAM integration for the dynamic values process
The Global Service Configuration: Report Server appears.
This process path becomes the default when importing dynamic values.
The following message appears: Confirmation: Configuration changes saved successfully.
Keyed lists are used in some predefined reports and in some predefined queries tagged as appropriate for action alerts. If you plan to use these reports or create alerts that use these queries, you can use any combination of the following approaches to maintaining your keyed lists.
If you plan to create custom reports that use a keyed list, you can add a custom key and then add or import its values.
You can identify the keyed list or lists used in a query and then update that list before scheduling a report or alert that includes that query.
Keyed lists let you create a group and assign values to it. You can then query the group name and any of the values in the group will return a positive result. You can assign values individually or import them from a .csv file. You can create custom keyed lists or add values to predefined lists.
For example, some queries for Privilege Grant reports search for a key value named "Privileged_Groups". When a query includes this value, it returns all rows where that field contains any of the values specified in the group.
To create a Keyed List
Keyed List Details appears in the right pane.
Note: The IT PAM dynamic values process updates only the Users list of the Keyed List Values table. The Users list is periodically overwritten with the latest values.
If the connection is successful, a confirmation message is displayed.
A highlighted row appears in the User column.
The values appear in the Values area.
Note: You can only import .csv files that do not contain special characters.
The new list appears in the User folder of the Keyed Lists folder.
You can update the values in a keyed list in several ways. One way is to add, edit, and delete values manually.
To update a keyed list manually
The added value appears in the Values list for the selected key.
A confirmation message appears.
The value is deleted from the Values list of the selected key.
The value is displayed with the modified name in the Values list of the selected key.
The values for the selected keys are updated.
If you store values that correspond to a key in an Excel spreadsheet, you can save that spreadsheet as a comma-separated values list (*.csv) and populate the Keyed List for the selected with an import.
You can update keyed list values you store in a CSV file in the following ways:
To update a keyed list with export or import
The Import file dialog appears.
The Values list is updated with the values from the CSV file.
A success confirmation appears.
The file is uploaded. You can scroll to the bottom of the Values list to confirm your new entry is present.
You can supply values for keyed lists in the following three ways:
Use the following example as a guide to updating the values in any user-defined keyed list where the values are stored in an Excel spreadsheet saved as a comma-separated values list (*.csv).
To update a keyed list with a CSV file
An Export dialog appears with file.csv as the default filename.
A confirmation message appears.
The file is uploaded. Scroll to the bottom of the Values list to confirm that your new entry is present.
If you use CA IT PAM processes to generate a list of values associated with a key used in CA User Activity Reporting Module queries, run the IT PAM dynamic values process from CA User Activity Reporting Module and update the values for a given key. Importing saves you the time of manually entering all the values for a given key. When values for one of your keys change, you can refresh them in CA User Activity Reporting Module by selecting the key and repeating the import of dynamic values.
Configure CA IT PAM integration for dynamic values before attempting to import keyed list values from CA IT PAM.
To import values for a keyed list from CA IT PAM
The first available row in the User column is selected
The Import Dynamic Values dialog appears.
The associated CA IT PAM process is run, a file with the results is returned, and values for the selected key are refreshed.
It is good practice to keep keyed lists updated with current values. To update a keyed list used in a particular report or alert, first identify the queries used in the report or alert. Then, determine the keyed list used in the source query or query. Queries that use a keyed lists often reference the keyed list name in the query name. For example, there are queries with "Default Accounts" or "Privileged Group" in the query name.
To determine keyed list usage for a query
Some predefined keys that are used in predefined reports have no predefined values. To use these reports effectively, you must supply values for the respective keyed lists. You can also add custom values to keyed lists with predefined values.
Examples of Keyed Lists that have no predefined values include:
You can add values to any keyed lists manually or by import.
This topic provides an example of adding custom values to a keyed list that has none provided by default. You can follow this example to add values to other existing keyed lists.
You can use certain reports and queries to monitor activities by your business critical hosts. To do this, you must first identify these hosts as values in the key-value list for Critical_Assets.
Reports that use the Critical_Assets list include the following:
Similar reports for CA Access Control, CA Identity Manager, and CA SiteMinder use the Critical_Assets keyed list, for example: CA Access Control - Account Creations by Business Critical Hosts.
Queries that use the Critical_Assets list include the following:
If you create a custom query on critical assets, define the filter as follows:
|
Column |
Operator |
Value |
|---|---|---|
|
dest_hostname |
Keyed |
Critical_Assets |
To define a filter for other keyed lists, replace the value with the list value you want. For example, you could set the filter value to EPHI_Database to filter for hostnames belonging to that keyed list.
To create keyed values for Critical_Assets
Reports using this keyed list that are generated by scheduled jobs begin reflecting data for the updated values.
This topic provides an example of adding custom values to a predefined keyed list that has some values already set. You can follow this example to add values to other existing keyed lists.
You can use predefined reports and their associated queries to monitor activities by your administrators. Predefined values include Administrator, root, sa, and admin. To customize the list, identify other accounts in your environment that have admin privileges as values in the key-value list for Administrators.
If you create a custom query that uses this key, define the filter as follows:
|
Column |
Operator |
Value |
|---|---|---|
|
dest_username |
Keyed |
Administrators |
To define a filter for other keyed lists, replace the value with the list value you want. For example, you could set the filter value to EPHI_Database to filter for hostnames belonging to that keyed list.
To customize keyed values for Administrators
A list of keys to which you add user-defined values is displayed at the bottom of the main pane.
The predefined values appear.
Reports using this keyed list that are generated by scheduled jobs begin reflecting data for the updated values.
You can view the results of a report before scheduling it to be generated. Certain predefined reports use keyed lists, where the key is predefined but the values are user-defined. Once you add or import values for a key, it is a good practice to view the report using the keyed list.
To view a report using a keyed list
|
Copyright © 2014 CA Technologies.
All rights reserved.
|
|