The Reporting Portal lets you view all the reports that have run earlier in DevTest Workstation. You can configure the reports either through the staging documents, quick tests, running test cases, or test suites.
This section looks at the reports that are generated by running the multi-tier-combo test case, which is located in the examples directory.
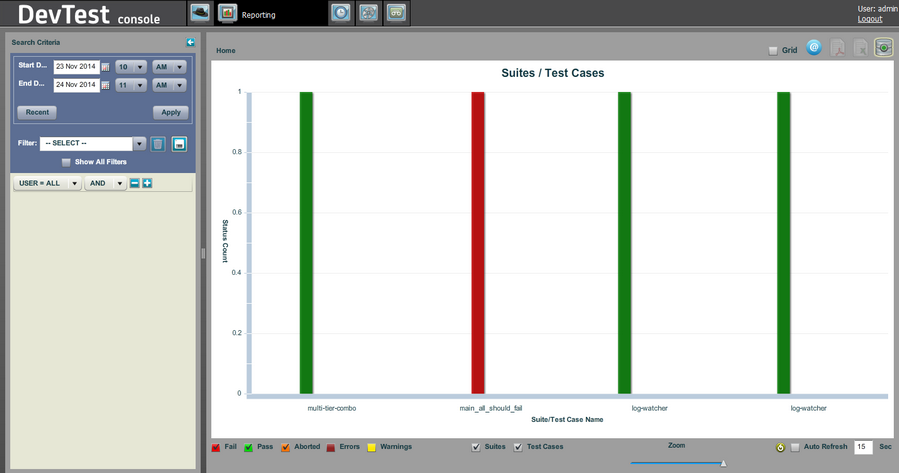
In the left panel, you can select the date and time criteria and can select the filters for use.
Select the start/end date by clicking Calendar ![]() . By default, the start and end dates are in the range of the last hour. Select the start and end time by clicking the 1-12 and AM/PM drop-downs. After you enter start and end dates, click Apply to apply your changes.
. By default, the start and end dates are in the range of the last hour. Select the start and end time by clicking the 1-12 and AM/PM drop-downs. After you enter start and end dates, click Apply to apply your changes.
To reset the date and time criteria automatically to find the last test/suite that was run and the hour before it, click this button.
You can create filters of your choice here. Enter the name of the filter and click Save. You can also delete a filter by clicking Delete. To show all filters, not merely ones you have created, select Show All Filters.
Select from the AND/OR operators for the criteria and click Add ![]() or Delete
or Delete ![]() .
.
The right panel consists of the graphs charted depending on the selected criteria. For more information, see Reports - Graphical View.
The Reporting Toolbar appears at the top of the right panel and allows you to:
|
Icon |
Function |
|
|
Changes the report view from the default chart view to the grid view, and back. For more information, see Reports - Grid View. |
|
|
Copies the URL of the report you are viewing to the operating system clipboard so you can share the report with other users. |
|
|
Exports the report data to a PDF file or Excel file to view report details in those formats. For more information, see Exporting Reports. |
|
|
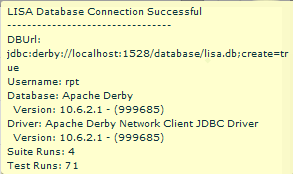
Displays information about the reporting database.
|
You can filter the reports on the results of test cases that have passed or failed. You can also select to show or hide errors and warnings, and show or hide test suites or test cases. For more information, see Filtering Reports.
The Zoom slider lets you customize the size of the report display.
The Refresh button ![]() refreshes the display. To set an auto-refresh, select the Autorefresh check box and set an interval for auto-refresh.
refreshes the display. To set an auto-refresh, select the Autorefresh check box and set an interval for auto-refresh.
|
Copyright © 2014 CA Technologies.
All rights reserved.
|
|