

The grid view displays the same information as the graphical view. The only difference is that it is displayed in a grid format. All report information filters work the same.
Note: You must be in the grid view to export reports to Excel.
To view the results in a grid, select Grid ![]() at the top of the window.
at the top of the window.
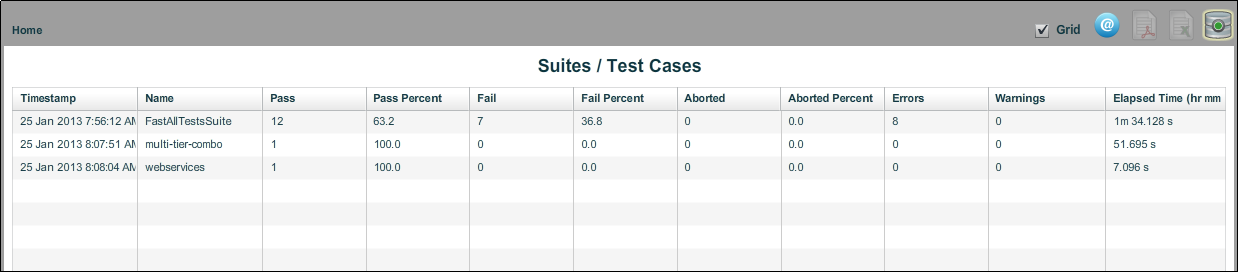
You can select each of the test cases in the report to find more details for the selected test case.
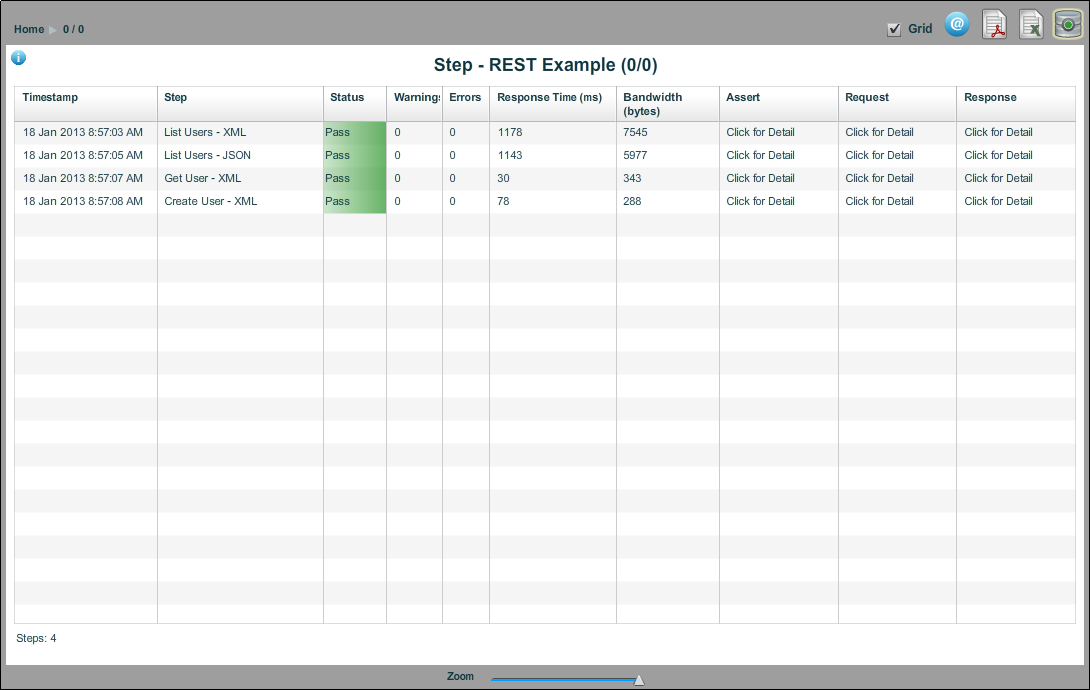
If you click Click for Detail in the Assert, Request, or Response columns, detailed information for each component of the step displays.
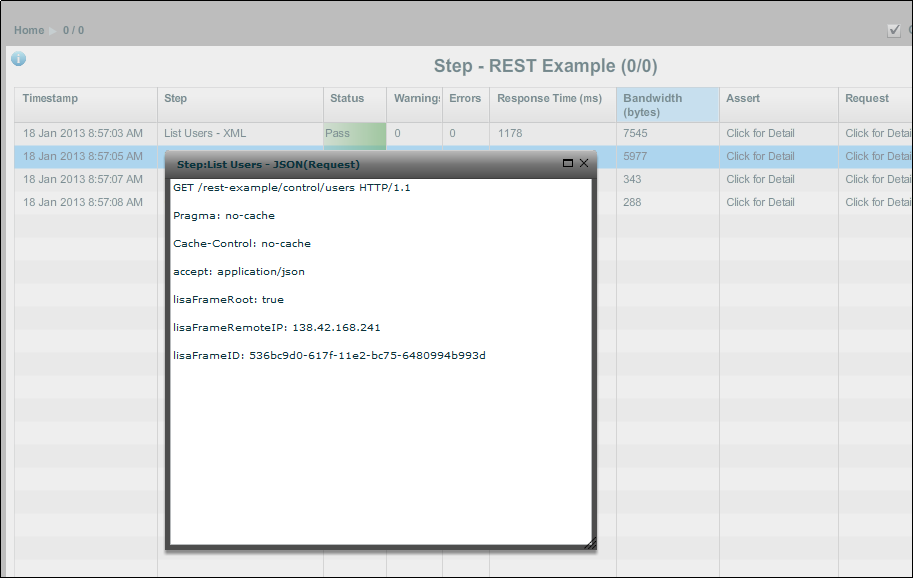
In this view, click to view request and response data. For data that is XML, you can select the Formatted XML tab to see formatted text. For non-XML data, the Formatted tab shows, "Text is not valid XML."
With the Performance Summary Report in grid view, you can select options from a Customize drop-down to indicate the percentile value to display in the last column of the report. The percentile value represents the maximum number of milliseconds for which a specific percentage of step runs were completed. For example, if the 75th longest running cycle of Step A finished in 7.9 seconds, the 75th percentile would be 7900 or greater.
|
Copyright © 2014 CA Technologies.
All rights reserved.
|
|