

This section contains the following topics:
Example: Enable Direct Collection Using the ODBCLogSensor
Example: Enable Direct Collection Using the WinRMLinuxLogSensor
View and Control Agent or Connector Status
With separate installations for specific platforms, CA User Activity Reporting Module agents provide the transport layer for getting events from event sources to the CA User Activity Reporting Module server's event log store. Agents use connectors to collect event logs from different event sources. The following diagram shows the interactions between agents and the CA User Activity Reporting Module server:
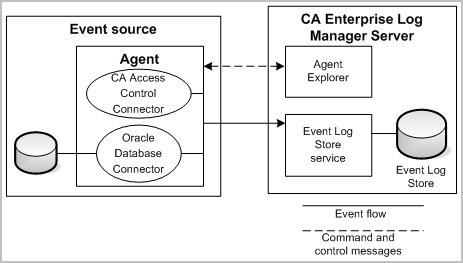
After you install an agent on an event source, you can configure one or more connectors to collect events from event sources such as devices, applications, operating systems, and databases. The examples in the diagram include connectors for CA Access Control and an Oracle database. You typically will install only one agent per host server or event source, but you can configure more than one type of connector on that agent. You can use the Agent Explorer that is part of the CA User Activity Reporting Module server to control agents and to configure and to control connectors on an agent. The Agent Explorer also allows you to create agent groups for easier management and control.
You base your configuration of a connector on either an integration or a listener, which are templates that can comprise files for data access, message parsing, and data mapping. CA User Activity Reporting Module provides a number of integrations for popular event sources out-of-the-box.
Immediately after you install a CA User Activity Reporting Module server, you have a default agent listed in the Agent Explorer. That agent is installed when you install the CA User Activity Reporting Module server, and you use it for direct syslog event collection.
The Agent Explorer tracks and lists agents as you install them in your network, and provides a centralized place for configuration, command, and control of agents and connectors. Agents register with the CA User Activity Reporting Module server you specify the first-time you start them. When that registration takes place, the agent name appears in the Agent Explorer and you are ready to configure a connector to begin event log collection. Connectors gather event logs and send them to the CA User Activity Reporting Module server. One agent can control many connectors.
Using the Agent Explorer to install, configure, and control connectors and agents involves the following basic steps:
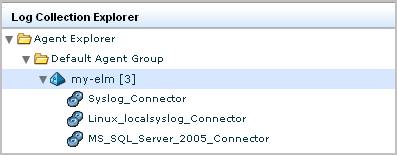
The CA User Activity Reporting Module installation creates a default agent on the CA User Activity Reporting Module server that has two connectors ready for use, a syslog_Connector and a Linux_local Connector. The syslog connector is available for collection of syslog events sent to the CA User Activity Reporting Module server. The Linux_local connector is available for collection of OS-level events from the CA User Activity Reporting Module physical server, or from a syslog file.
In the basic two-server environment, configure one or more syslog connectors on the collection server to receive events.
The process for using the default agent includes the following steps:
You can review the default syslog integrations and listeners before you create a connector. Listeners are essentially a template for your syslog connectors that use specific syslog integrations provided as out-of-the-box content with your CA User Activity Reporting Module server.
To review syslog integrations
The integration details display in the right side window. You can review which message parsing and data mapping file the integration uses and other details such as version and lists of suppression rules and summarization rules.
To review a syslog listener
The default listener details display in the right side window. You can review details such as versions, suppression and summarization rules, the default ports on which to listen, a list of trusted hosts, and the listener's time zone.
Create a syslog connector to receive syslog events using the default agent on the CA User Activity Reporting Module server.
To create a syslog connector for the default agent
The default agent is automatically installed into the Default Agent Group. You can move this agent to another group.
The default agent has the same name you gave the CA User Activity Reporting Module server during installation.
Note: When a CA User Activity Reporting Module agent does not run as root, it cannot open a port below 1024. The default syslog connector therefore uses UDP port 40514. The installation applies a firewall rule to the CA User Activity Reporting Module server to redirect traffic from port 514 through 40514.
The connector begins collecting syslog events that match the selected integrations on the ports you specified.
You can verify that the connector on the default agent is collecting syslog events with the following procedure.
To verify syslog event receipt
You should see events listed for the default agent, if the you configured the connector correctly and the event source is actively sending events.
You can enable direct collection of events generated by specific databases and CA products with the ODBCLogSensor. To do this, you create a connector on the default agent that is based on an integration that uses the ODBCLogSensor. Many integrations use this sensor, for example, CA_Federation_Manager, CAIdentityManager, Oracle10g, Oracle9i, and MS_SQL_Server_2005.
Following is a partial list of products that generate events that can be collected directly by the default agent on a CA User Activity Reporting Module server. For each product, a unique connector is used; each connector uses the ODBCLogSensor.
For a complete list, see the Product Integration Matrix on Support Online.
This example shows how to enable direct collection of events from a Microsoft SQL Server database. The connector deployed on the default agent is based on the MS_SQL_Server_2005 integration. In this example, the SQL Server database resides on an ODBC server. The connector deployed to the CA User Activity Reporting Module agent collects events from the MSSQL_TRACE table. Part of enabling the collection of events from a Microsoft SQL Server database is to direct selected events to this trace table. You can find explicit directions for doing this in the CA Connector Guide for Microsoft SQL Server.
To learn how to configure the Microsoft SQL Server event source
The View Integration Details displays the sensor name, ODBCLogSensor. Supported platforms include both Windows and Linux.
The Connector Guide for Microsoft SQL Server appears.
To configure the event source and verify logging
Note: Keep a record of the name of the database under which you create the trace table. You must specify that database name in the connection string. For example: master.
To create a connector on the default agent to retrieve events generated by a SQL Server database on an ODBC Server
The default agent can have other connectors deployed to it.
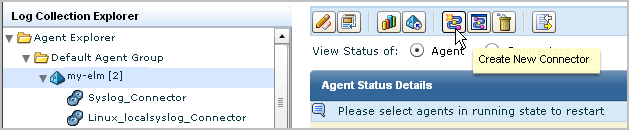
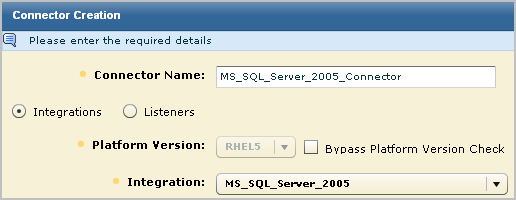
The New Connector Creation wizard opens with the Connector Details step selected.
This selection populates the Connector Name field with MS_SQL_Server_2005_Connector.
For example, select MSSQL_2005_Authorization 12.0.44.12.
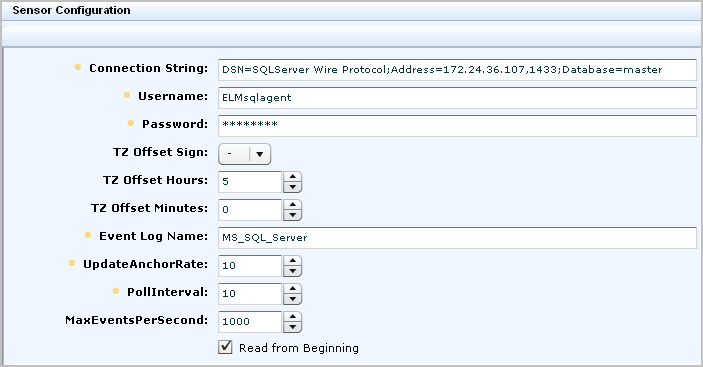
Instructions include CA Enterprise Log Manager Sensor Configuration Requirements for both Windows and Linux.
DSN=SQLServer Wire Protocol;Address=IPaddress,port;Database=databasename
Note: On a Window server, this information appears on the Time Zone tab of Date and Time Properties. Open the clock on the system tray.
A partial example follows:
The new connector name displays under the agent in the Agent Explorer.
Initially, the status shows Configuration pending. Wait until that status shows Running.

Note: You can also run a report to view data from this database.
To verify that the default agent is collecting events from the target event source
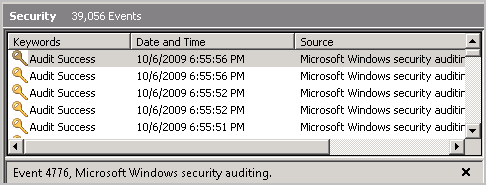
Collected events are displayed. The first two are internal events. Those that follow are events collected from the MS SQL trace table you configured.
Note: If the expected events are not displayed, click Global Filters and Settings in the main toolbar, set the Time Range to No Limit, and save the setting.
You can enable direct collection of events generated by Windows applications or the Windows Server 2008 operating system with the WinRMLinuxLogSensor. To do this, you create a connector on the default agent that is based on an integration that uses the WinRMLinuxLogSensor. Many integrations use this sensor, for example, Active_Directory_Certificate_Services, Forefront_Security_for_Exchange_Server, Hyper-V, MS_OCS, and WinRM. The Microsoft Windows application and operating system that generate events that can be retrieved by the WinRMLinuxLogSensor are those for which Windows Remote Management is enabled.
Following is a partial list of products that generate events that can be collected directly by the default agent on a CA User Activity Reporting Module server. For each product, a unique connector is used; each connector uses the WinRMLinuxLogSensor.
For a complete list, see the Product Integration Matrix on Support Online.
This example shows how to enable direct collection of events using a connector based on the WinRM integration. When such a connector is deployed, it collects events from a Windows Server 2008 operating system event source. Collection begins after you configure the event sources to log events in the Windows Event Viewer and enable Windows Remote Management on the server as specified in the Connector Guide associated with this integration.
To learn how to configure the Windows Server 2008 event source
The View Integrations Details displays the sensor name, WinRMLinuxLogSensor. Supported platforms include both Windows and Linux.
The Connector Guide for Microsoft Windows Server 2008--WinRM appears.
To configure the event source and verify logging
Note: Part of this process is creating the user name and password that you must enter when you configure the connector. These credentials enable authentication required to establish connectivity between the event source and CA User Activity Reporting Module.
The Event Viewer appears.
A display similar to the following indicates that logging is occurring.
To enable direct collection of events from Windows event sources
The default agent may have other connectors deployed to it.
The New Connector Creation wizard opens with the Connector Details step selected.
For example, choose WinRM.
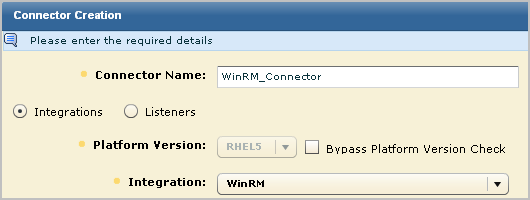
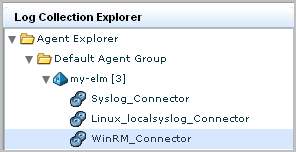
This selection populates the Connector Name field with WinRM_Connector
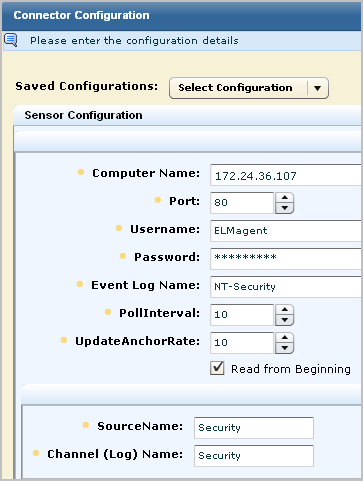
Instructions include CA User Activity Reporting Module Sensor Configuration--WinRM.
![]()
An example follows:
Initially, the status shows Configuration pending. Wait until that status shows Running.
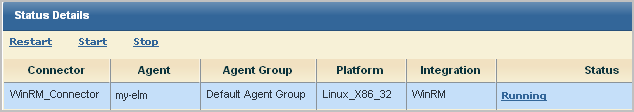
To verify that the default agent is collecting events from the target event source
You can monitor the status of agents or connectors in your environment, restart agents, and start, stop, and restart connectors as needed.
You can view agents or connectors from different levels of the Agent Explorer folder hierarchy. Each level narrows the available view accordingly:
You can determine the FIPS mode (FIPS or non-FIPS) for an agent from all three levels.
To view agent or connector status
The Log Collection folder list appears.
Agent management buttons appear in the details pane.
The status panel appears.
The agent or connector search panel appears.
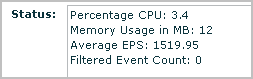
A details chart appears, displaying status for agents or connectors that match your search. For example:
Total: 10 Running: 8 Pending: 1 Stopped: 1 Not Responding: 0
Note: You can click the On Demand button for an agent or connector to refresh the status display.
|
Copyright © 2014 CA Technologies.
All rights reserved.
|
|