

The Metric Details page provides detailed charts of the collected data for each performance metric.
In the Metric Details charts, collected data is graphed over an X-axis showing the time frame. A line highlights the number of applicable data observations used in the ratings: calls originated or call minutes. The total number of observations is shown in the legend for each data view.
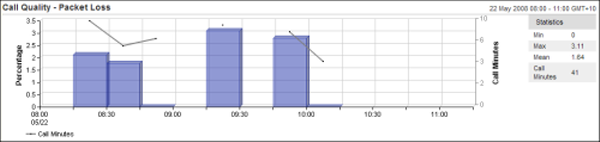
A logarithmic scale on the right Y-axis shows the number of observations. The Y-axis on the left side of each view plots the metric itself. In the following example, data loss rose above two percent when call activity spiked at around ten call minutes:
The legends provide more statistics that were calculated when analyzing data for each metric.
In a few cases, older or lower-end IP telephones do not support the collection of some performance statistics. For example, the Cisco model 7902 telephone returns only values for received packets and lost packets. Therefore, UC Monitor reports only packet loss for this model.
|
Copyright © 2012 CA.
All rights reserved.
|
|