

This three-part report gives business unit leaders an understanding of the storage environment as it relates to their organization.
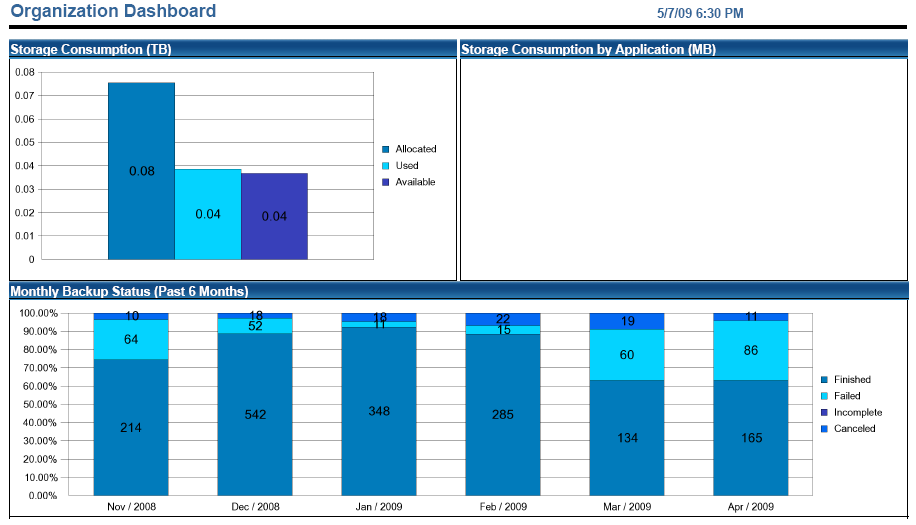
When you refresh this report, you receive a prompts to enter the organization. Only the reports for that organization are refreshed. This bar chart shows the totals as they relate to the selected organization.
This pie chart shows the sum total in raw numbers of storage consumption by application, where each application is a total capacity used by the given application compiled from all servers.
This stacked bar chart/line chart shows the monthly breakdown of the backup status across all backup products managed by CA SRM. Each monthly stack shows the percentages of Success, Failed, Incomplete, and Canceled from past 6 month's duration.
|
Copyright © 2013 CA.
All rights reserved.
|
|