This six-part report gives the Storage Administrator a snapshot view of storage consumption across the enterprise.
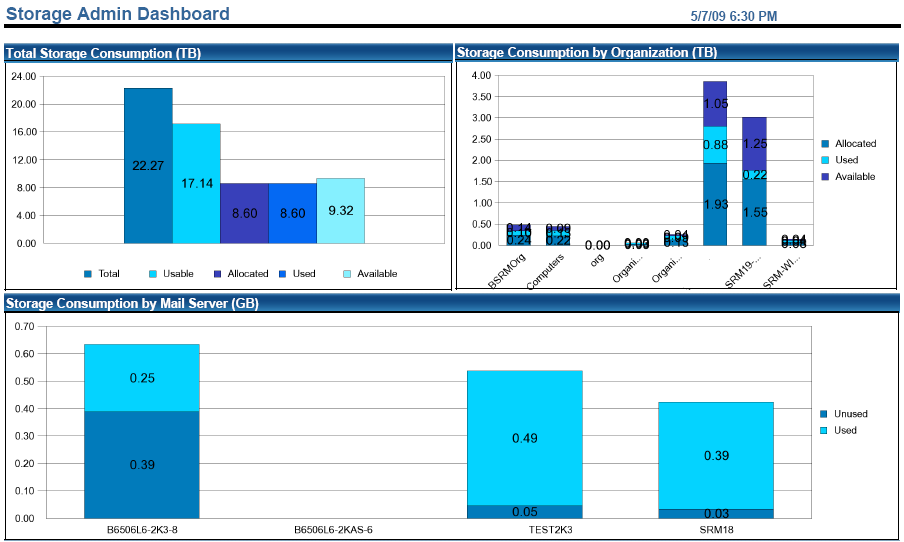
- Total Storage Consumption
-
This bar chart shows the total of all storage with the following subtotals:
- Usable–shows all storage that can be allocated to a server.
- Allocated–shows storage allocated to all servers.
- Used–shows how much of the total allocated storage is being used.
- Available–shows the result of the usable storage minus the allocated storage.
- Storage Consumption by Organization
-
This bar chart shows the storage allocation for organizations:
- Allocated–shows the sum of storage allocated to all servers in an organization.
- Used–shows how much of the total allocated storage is being used by an organization.
- Available–shows the result of the usable minus the allocated storage for an organization.
- Storage Consumption by Mail Server
-
This is a breakdown of each mail server's storage usage:
- Used–total storage on the server
- Unused–total storage on the server
- Storage Consumption by Application
-
This bar chart shows the consumption by application where each application is a total capacity used by the given application rolled up from all CA SRM servers. The figures used are the sum total of the space allocated to the application, not the percentage.
- Protection by Organization (Current Month)
-
This stacked bar chart shows the current month's backup status count broken down by organization and four different statuses.
- Capacity by RAID Type
-
Total Storage by Raid Type show the Total Disk Array storage by RaidType:
- Total–Shows all the disk array storage of the RaidType
- Usable–shows all storage of the RaidType that can be allocated
- Allocated–shows storage storage of the RaidType that is allocated
- Assigned–shows how much of the total allocated storage of the RaidType is assigned to Servers.
- UnAllocated–shows the result of the usable storage minus the allocated storage.