

This four-part report gives you a high-level understanding of the storage infrastructure. The single view consists of four different charts, which are each summaries of all data across the enterprise.
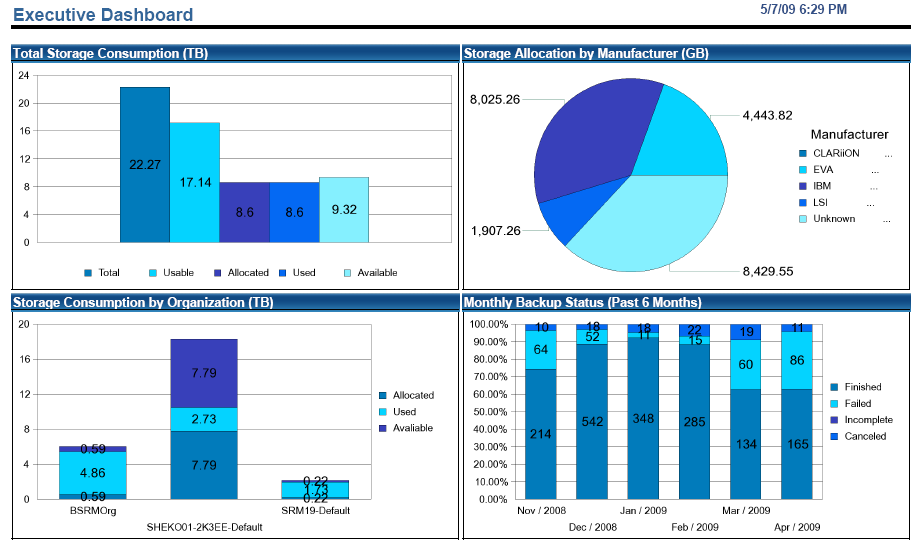
This bar chart shows the total of all storage with the following subtotals:
This pie chart shows all of the disk arrays by manufacturer. It lists the total storage in raw numbers, opposed to percentages, so the figures equate to the total in the Storage Consumption Report.
This stacked bar chart is similar to the Total Storage Consumption, but only shows the storage allocated by business unit with the following subtotals:
This stacked bar chart/line chart shows a monthly breakdown of the backup statuses across all backup products managed by CA SRM. Each monthly stack includes percentages for Success, Failed, Incomplete, and Canceled. The line chart tracks the total count of jobs for each month from past 6 month's duration.
|
Copyright © 2013 CA.
All rights reserved.
|
|