

The Trend menu displays only when you view trend data in the Trend view, subsequently the Trend menu only appears on objects where trend data has been collected for the object. The Trend Menu options let you maintain trend definition and how the graphical trend is displayed. The following options are available for the Trend menu:
Use this menu option to display source objects of the trend data.
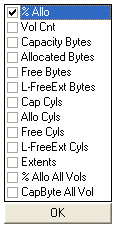
Use this menu option to select the object fields for which you want to collect trend data. The following is an example of the data source list for the Storage Groups object:
Use this menu option to select the trend period. When selected the View and Output Definitions wizard will be displayed at the Trend Period dialog.
Note: For instructions on how to use the Trend Period dialog, see the section Trend - Periods.
Use this menu option to maintain the name of your trend report. When selected the View and Output Definitions wizard will be displayed at the Trend Titles dialog.
Note: For instructions on how to use the Trend Titles dialog in the View and Output Definitions wizard, see the section Trend - Titles.
Use this menu option to maintain combinations of multiple data trends into the displayed trend, or to focus on specific trend characteristics. When selected the View and Output Definitions wizard will be displayed at the Aggregation dialog.
Note: For instructions on how to use the Aggregation dialog in the View and Output Definitions wizard, see the section Trend - Aggregation.
Use this menu option to define the minimum, maximum, and reference scale values in your trend report. When selected the View and Output Definitions wizard will be displayed at the Y-Axis dialog.
Note: For instructions on how to use the Y-Axis dialog in the View and Output Definitions wizard, see the section Trend - Y Axis.
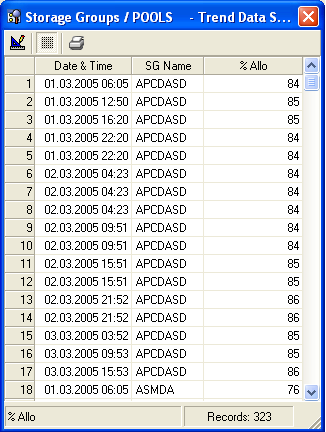
Use this menu option to display the list of raw data used to create the trend graph. The following is an example of the Trend Data Sheet dialog of a Storage Group trend report:
|
Copyright © 2013 CA.
All rights reserved.
|
|