

User Views › Object Menu Bar › Options Menu › View and Output Definition Wizard › Trend - Aggregation
Trend - Aggregation
Use the Aggregation page of the View and Output Definition wizard to combine multiple data trends into a single one, or to focus on specific trend characteristics. The following shows the Aggregation page:
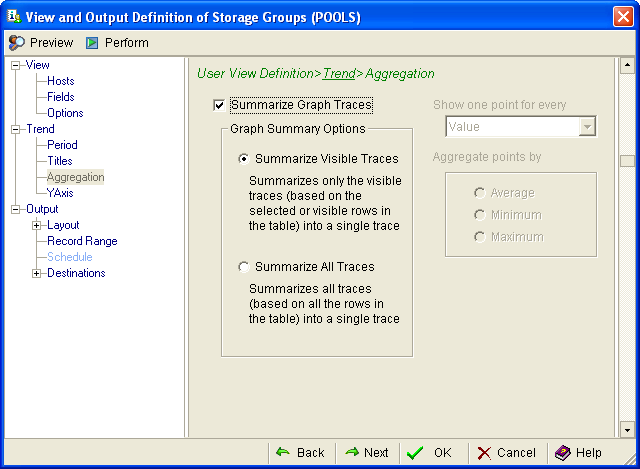
To combine multiple trends
- Click the Summarize Graph Traces check box to enable the aggregation parameters.
- Select one of the following options:
- Summarize Visible Traces to consolidate all selected or displayed object values into a single trace.
- Summarize All Traces to consolidate all available object values into a single trace.
- Click OK to compile the new trend report.
To report specific trend characteristics
- Leave the Summarize Graph Traces box unchecked.
- In the Show one point for every field, click the down arrow and select an interval:
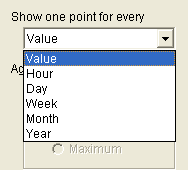
- In the Aggregate points by field, select the Average, Minimum, or Maximum check box.
- Click OK to compile the new trend report.
Copyright © 2013 CA.
All rights reserved.
|
|