

User Views › Object Menu Bar › Options Menu › View and Output Definition Wizard › Trend - Y Axis
Trend - Y Axis
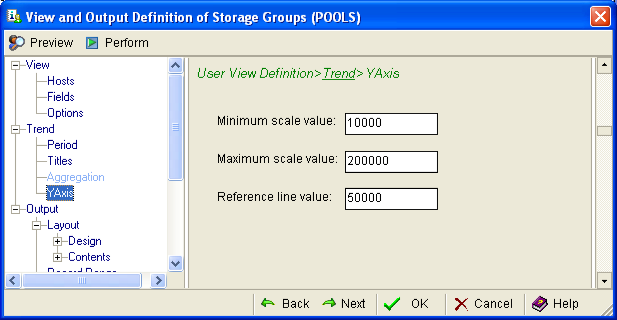
Use the Trend Y Axis page of the View and Output Definition wizard to define the minimum, maximum, and reference scale values in your trend report. The following shows the Trend Y Axis page:
To define the minimum, maximum, and reference scale values
- In the Minimum scale value field, set a value below your anticipated lowest value.
- In the Maximum scale value, set a value above your anticipated highest value.
- In the Reference line value, set a nominal, average, or baseline value against which lower or higher values can be easily compared.
Copyright © 2013 CA.
All rights reserved.
|
|