

In addition to the Table View menu and toolbar options you can also perform some quick appearance changes to the Table View as follows:
How to perform these changes is explained in the following procedures.
Note: The following options and more options for customizing a view are available in the View and Output Definition option. For more information, see the section View and Output Definition Dialog.
To Quick Find in Column
Instead of scrolling down to a row you can quickly find a particular item. To do this you can use the Find in Column option by following these steps:
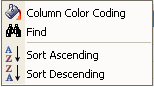
The Column Options Menu is displayed as shown in the following sample:
The Find dialog is displayed.
The Table View of the object is updated and the first item containing your find criteria is displayed. If the criterion is not found in the column then you will receive a message advising it is not found.
To Quick Sort on Columns
You can perform quick sorts in the Table View by clicking a column heading title cell and the table will sort by that column in descending order. Click the column heading title cell again and the table will sort by that column in ascending order.
You can also right-click a column heading and the Column Options Menu is displayed where you can select the Sort Ascending or Sort Descending options.
Note: After you have created a Table View column sort in this manner you may want to remove it; to remove a Table View column sort, click the Sort icon and use the Exclude a Field option or the Exclude all Fields option. For more information, see the section Defining a Sort.
To Quick Color Code a Column
You can highlight certain values in columns by color coding them when specific criteria is met. You have two options for color coding, you can use the Quick Color Code a Column option or you can use the View and Output Destination – Fields option (see the section View - Fields).
Example of how to use the Quick Color Code a Column option
The following is an example procedure of how to use the Quick Color Code a Column option on the Volumes column in the Storage Group Volumes object:
The Column Options Menu is displayed.
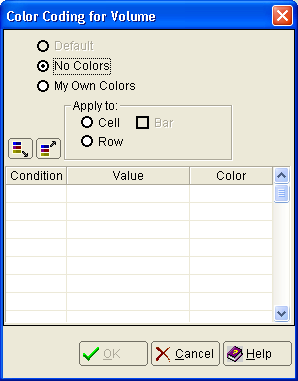
The Column Color Code dialog is displayed. The following is a sample of the Column Color Code dialog displayed for the Volumes column in the Storage Group Volumes object:
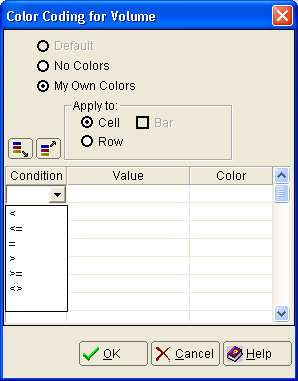
A down arrow appears on the right side of the cell.
The Condition options are displayed as shown in the following sample:
The condition selected is displayed in the cell.
The value is displayed in the cell.
The Color dialog is displayed.
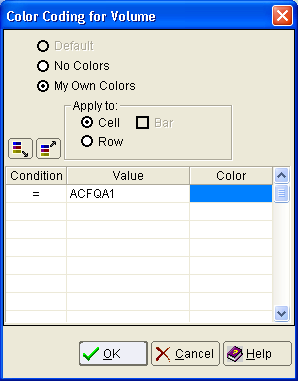
The Column Color Code dialog is displayed showing the condition, value and color you have specified.
The following is an example of the Column Color Code dialog where the condition is ‘=’, the value is ‘ACFQA1‘ and the color is blue for the Volumes column in the Storage Group Volumes object:
The Table View of the object is displayed with your color code settings.
Observe the following:
For example: if you color code two conditions in the dialog such that ‘= AAAA1 Blue’ is listed first, and then ‘> AAAA0 Red’ is listed second in the dialog then the GMI Windows Client will apply the ‘= AAAA1 Blue’ condition to all AAAA1 items, then it will apply the second condition, ‘> AAAA0 Red’, to any items that meets the second condition but where the first condition has not been applied. If the conditions are reversed in the dialog so that ‘> AAAA0 Red’ is first and ‘= AAAA1 Blue’ is listed second in the dialog, then the second condition, ‘=AAAA1 Blue’, would be ignored because items with values AAAA1 have already met the first condition and the red color coding is already applied to them.
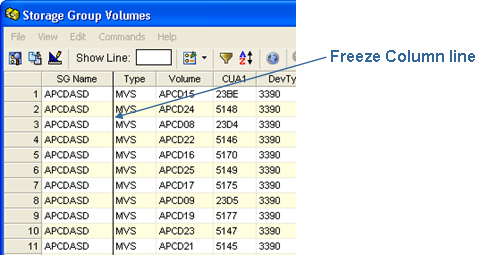
To Move the Freeze Column Line
Frozen columns are the left most columns that remain visible when the table is scrolled horizontally. The black vertical line separating columns is the Freeze Column Line, it divides the frozen columns from the scrollable area. For most objects, the Windows Client freezes the first left column. You may change the number of frozen columns by drag-and-dropping the Freeze Column Line to the right or to the left. Dragging the Freeze Column Line to the left, past the first column makes all the columns scrollable. The following illustration shows the factory default Freeze Column Line for the Storage Group Volumes object:
Example of how to include the Type and Volumes columns as Freeze Columns
Note: You can similarly include as many columns as you want as freeze columns in any Table View of an object.
Note: You must drag-and-drop the line from anywhere below the column heading portion of the line, that is, it will not work if you drag-and-drop the section of the line between the column headings.
The Freeze Column Line is now displayed between the Volume and the CUA1 columns as shown in the following sample:
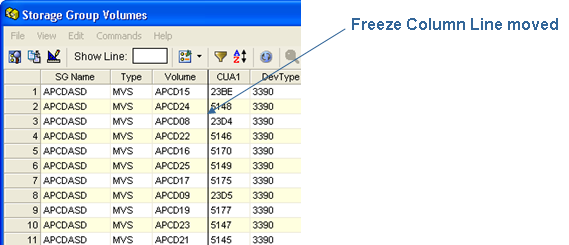
When you now scroll to the right in the Storage Group Volumes object the SG Name, Type and Volume columns will always be displayed in the left columns of the view.
Observe the following:
|
Copyright © 2013 CA.
All rights reserved.
|
|