

Navigating the Windows Client Interface › Toolbar › Object Tree View › Defining View Parameters
Defining View Parameters
You can customize the view of any object, that is you can decide which fields to display, the order of those fields, colors to be assigned to the fields, sorting criteria, and scaling for numeric fields (the units in which numerical data is displayed). You can also specify the hosts from which data is to be retrieved for the view, and set multi-host and automatic execution options.
These parameters allow you to create specialized views that help you highlight critical or most commonly-used information for various purposes.
To change the color of an important threshold, such as percentage of total allocated storage group capacity
- Open an object view table by clicking the object in the Object Tree.
- Note: For this example, we are using the Percent Allocated - SGs factory-supplied user-view object.
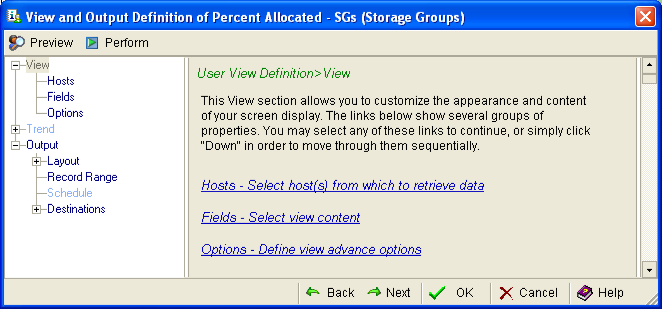
- Select View, View and Output Definition. The View and Output Definition dialog appears, shown in the following example.
- In the left pane of the View and Output dialog, under the View heading, select Fields.
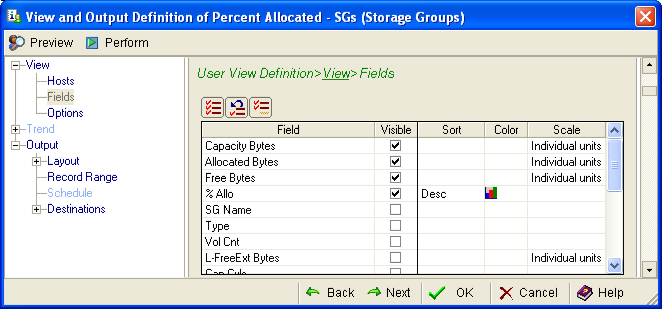
- Check % Allo in the Visible column to view it after the table is generated.
- In the % Allo row, click the Color cell to define a color for the data row, as shown in the following example:
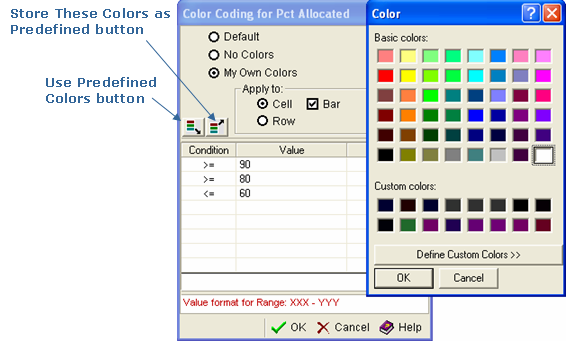
The Color Coding dialog is displayed:
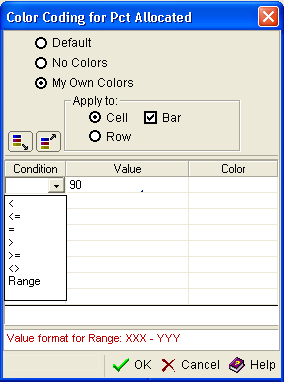
- At the top of the dialog, click My Own Colors radio button.
- In the Apply to section of the dialog, select one of the following options:
- Select Cell to limit the assigned color to only the Percent Allocation cell in each row of the table.
- Select Row to extend the assigned colors to entire row of each row reported.
- Select Bar if you want the width of the color bar in each cell to reflect the percentage of the value. The width of the color bar will narrow as the percentage decreases, and widen as it increases.
- Click the top-most cell under Condition to show the drop-down condition qualifier. Select the appropriate symbol to qualify the color you want to define. Use the symbol to construct value statements such as the following:
Any value less than 70% appears green.
Any value more than 95% appears red.
- Click the top-most cell under Value. Enter a percentage value that is appropriate for the symbol you selected in Step 8. This will be a value in the range of greater than or equal to 0 but less than or equal to 100.
- Click the top-most cell under Color. The Define Custom Color dialog opens, as shown in the following example. Select an existing color or define a new one.
When coding colors, the Windows Client checks the conditions sequentially until the first match occurs and it uses ANSII character sort order for the comparison (example: 0-9, A-Z, and a-z). And note there are no "and" or "or" condition statements available for color coding, there are simply the 'less than', 'less than or equal to', 'equal to', 'greater than', 'greater than or equal to', and 'less than or greater than' conditions available for comparison to the values you provide in the dialog.
If you define one or more new colors, and want to be able to use them in the future, click the Store These Colors as Predefined button. If you have previously defined colors that you wish to apply to a new view you have created, click the Use Predefined Colors button.
- Click OK to close the Define Custom Color dialog. Click OK at the bottom of the Color Coding dialog to apply your settings.
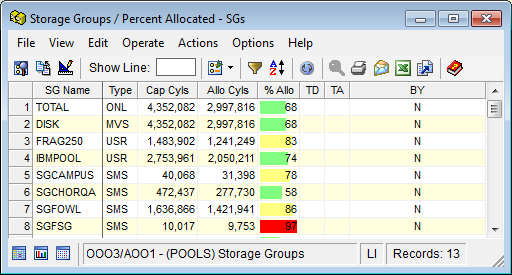
You can define other colors and thresholds to help you instantly note important data in the different object views you use regularly. The following is an example of a Storage Groups user-defined view which has coloring for condition statements for the %Alloc field:
Copyright © 2013 CA.
All rights reserved.
|
|