

The Contents portion of the View and Output Definition wizard includes pages for configuring tables, graphs, and trends. To include table, graph, and trend formatted data in your report, check the appropriate check box. The following is an example of the Contents page:
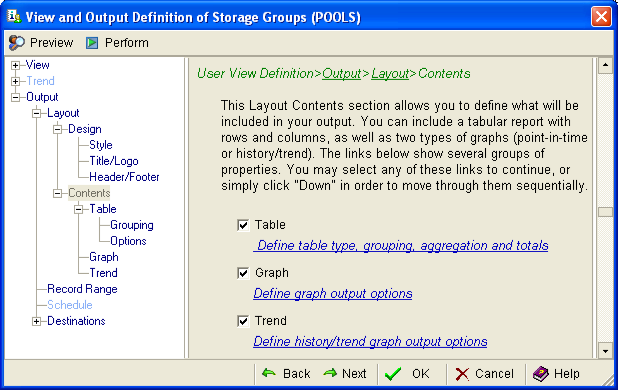
Note: The format (graph, table, trend or a combination of these) of the report generated by the Output Report option (the option found in the object File menu) is determined by the settings in the Contents page of the View and Output Definition wizard. For example, if you select Table and deselect Graph and Trend in the Contents page of the View and Output Definition wizard and then generate the report from the Output Report option, the report will be table format only. The request for a Trend report is ignored if trend data is not available (that is, if trend data is not collected).
|
Copyright © 2013 CA.
All rights reserved.
|
|