

Using CA Application Test › Using the Workstation and Console with CA Application Test › Continuous Validation Service (CVS) › CVS Dashboard Overview › CVS Dashboard - Graphs
CVS Dashboard - Graphs
The Graphs tab displays the tests in the CVS Dashboard in a graphical format. This tab provides a graphical summary of the tests that have passed and failed.
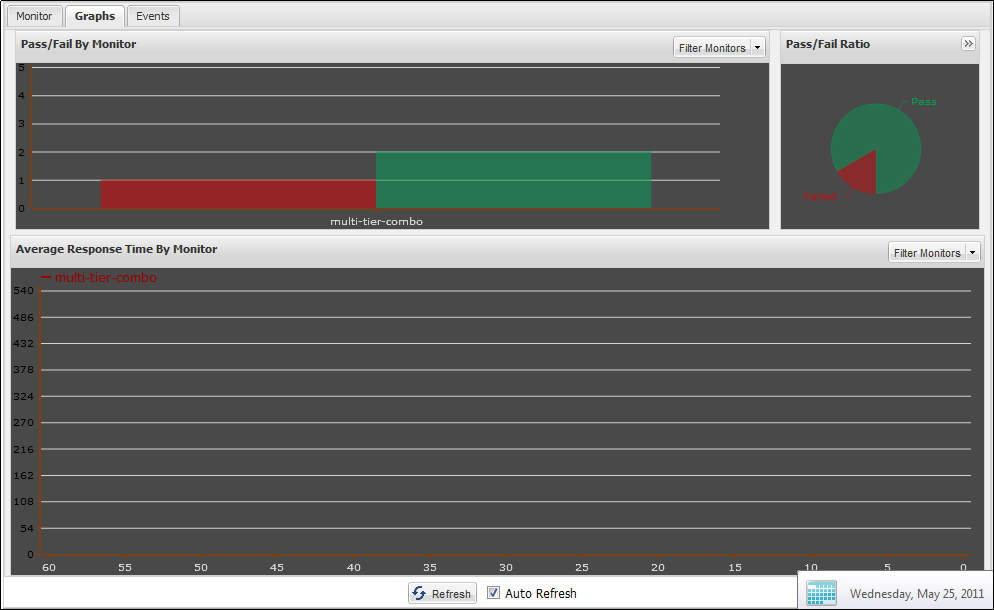
The Graphs tab consists of three graphical displays, which show and track the last 60 minutes of activity.
The Filter Monitor lets you select the specific monitors that you want to view.
Follow these steps:
- Click Filter Monitors at the top of the window.
A list of available monitors opens.
- Select the monitor that you want to review.
The details display in the following sections:
- Pass/Fail by Monitor: The Pass/Fail by Monitor graph shows stacked histograms of Pass/Fail results for each monitor. Moving the cursor over the histogram shows the result in text form In the top Pass/Fail By Monitor panel.
- Pass/Fail Ratio: The Pass/Fail Ratio graph displays the percentage of total number of passing tests (green), and the total number of failing tests (red) as a pie chart.
- Average Response Time by Monitor: Average Response Time by Monitor graphs the average response time for each monitor over the last 60 minutes of activity. Each monitor is color-coded. Hover over a monitor to show the average response time in a tooltip.
You can select to display the test/suite to be seen in the graphical format in the Pass/Fail By Monitor.
Copyright © 2014 CA Technologies.
All rights reserved.
|
|