

Using CA Application Test › Using the Workstation and Console with CA Application Test › Continuous Validation Service (CVS) › CVS Dashboard Overview
CVS Dashboard Overview
The CVS Dashboard has the following tabs:
- Monitor: Displays a list of all the monitors (tests/test suites) that are added to the CVS Dashboard. Your CVS Dashboard lists all monitors running on an attached DevTest registry, not only the ones that you initiate.
- Graphs: Displays the dashboard status graphically. This tab also shows the percentage of the tests that passed or failed.
- Events: Displays the status events that the monitors record.
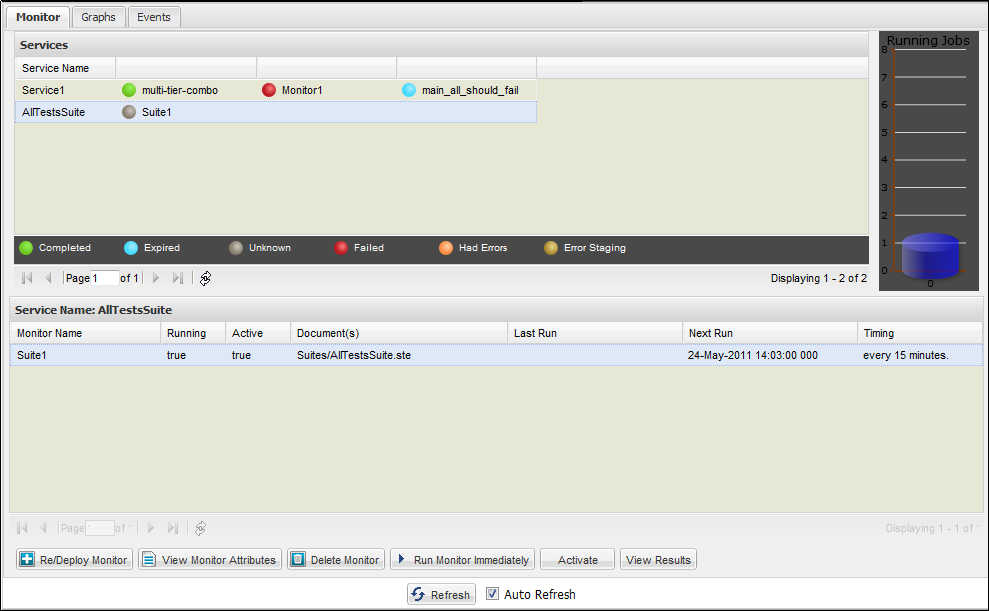
To refresh the list that is displayed on the CVS Dashboard, click Refresh at the bottom of the window.
Copyright © 2014 CA Technologies.
All rights reserved.
|
|