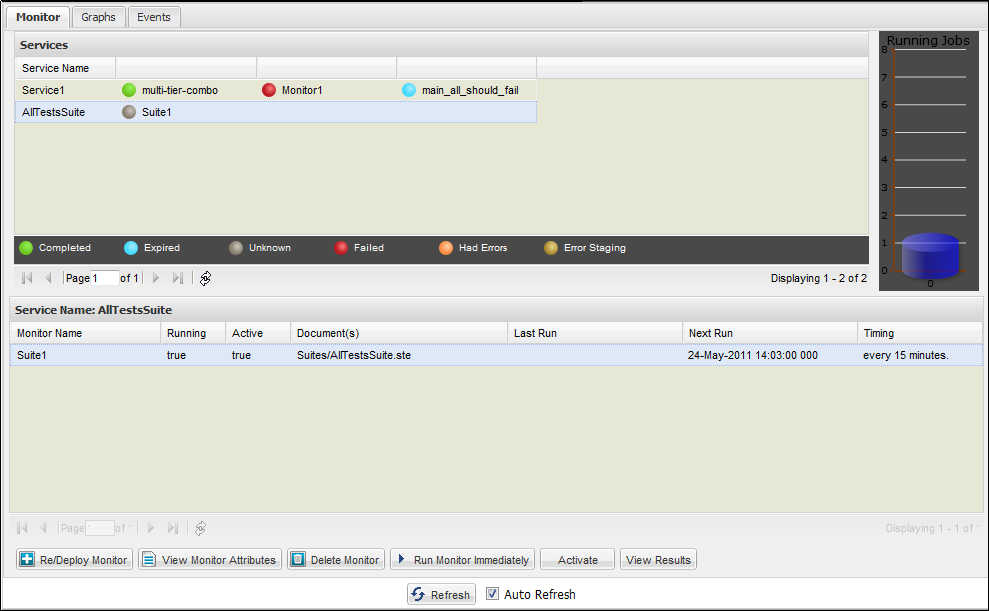

The CVS Dashboard opens with the Monitor tab active.
You can add many monitors to run in one or many services. A service contains one or more monitors.
You can schedule to run a service. All monitors in that service are run at the scheduled time. The services are run in the background at scheduled intervals.
You can either add the monitors in one service (in the following example, Service1) or add the monitors in different services (in the following example, Service1 and AllTestsSuite). All the monitors added in one service (for example, Service1) are shown added after that service name.

Top Panel
All the tests in a specific service that have run are shown with a colored ball:
The icons show the Test Run Completion, Failure, Error, Staging Error, or Unknown Error. These icons show the state of the monitor after it has run.

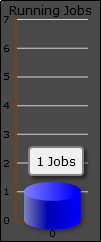
At the right side, the top panel shows a graphical representation of the jobs that are currently running. For example, the following graph shows one job currently running.

Bottom Panel
The bottom panel displays the status of each monitor that is run in a service.
The bottom panel shows all the monitors that are running or have finished their last run. The monitors that have finished running completely (are not scheduled to run again) do not display in this list.

The table shows the following information:
You can customize the columns by arranging them in sorted order or by showing or hiding the columns.
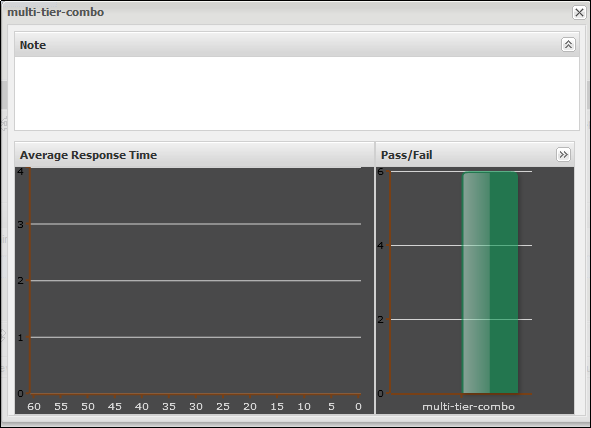
To see the monitor-related information, double-click a monitor.

Toolbar
The Toolbar tab includes a toolbar with the following buttons:
When you are running the CVS Dashboard directly from DevTest Workstation (by selecting to view the dashboard from DevTest), you also see the following buttons:
When you run the CVS Dashboard directly from your browser, these buttons do not appear.
|
Copyright © 2014 CA Technologies.
All rights reserved.
|
|