

|
|
|
Cumulative Flow chart presents the relative amount of work for each stage of project over time. Colored areas on the diagram represent work in progress for each stage of a process.
The following figure displays the Cumulative Flow chart generated for the period between February and July.
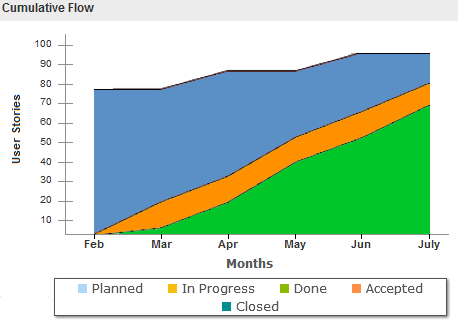
The vertical axis of the chart displays how many items are currently in progress. The horizontal axis displays the duration it takes for a task to complete. Measuring the horizontal axis on a Cumulative Flow chart allows you to monitor the Cycle Time and forecast when all the work in progress will complete. Vertical axis helps you to set the right WIP limits.
Follow these steps:
You have successfully used Kanban Board to manage and track the product backlog work.
| Copyright © 2012 CA. All rights reserved. |
|