

|
|
|
Cycle Time starts when the actual work begins and it ends when the task is finished. Cycle Time is a key metric that helps to make realistic commitments, and provides insight into whether improvements are yielding expected results.
Every time cards are pulled off the board, Cycle Times for each task is measured and chart is generated. Cycle Time chart presents the average time it takes for a task to process between the specified start and end lanes. You can define the time period for which the tasks are included in the chart. The chart is used to analyze the time required to traverse work items and make improvements in the project performance.
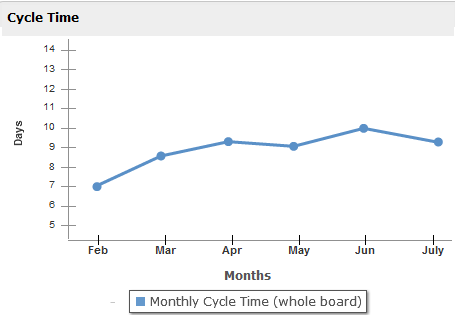
The following figure displays the Cycle Time generated for the period between February and July.
| Copyright © 2012 CA. All rights reserved. |
|