

The examples in this section show how the root cause and symptoms display in the Operations Console, depending on the Root Cause Analysis global setting.
The three examples that follow use a service that is named "Service_A." This service is modeled in CA SOI and contains a server that is named "server1" and a router that is named "router1." The examples use the Sample Connector for its data. The following graphic shows the service topology:
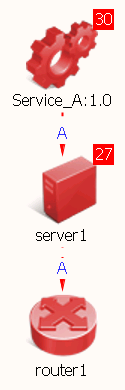
The domain manager is CA Spectrum, which is configured to determine root cause, and symptoms. In each example, you will see how changing the root cause analysis mode changes the root cause and symptoms on the Operations Console.
|
Copyright © 2013 CA.
All rights reserved.
|
|