

Impact indicates how much a CI affects a service and related CIs. The following factors determine impact:
Impact provides IT personnel with a good understanding of what fault conditions really mean to the services that CIs support.
CA SOI calculates the impact by multiplying severity by significance. Significance is a number from 1 (lowest) to 10 (highest), and severity ranges from 0 (Normal) to 4 (Down). Therefore, the highest possible impact is 40. Consider an application with a severity of 4 and a significance of 4. The resulting impact is 16.
Note: When a custom propagation policy connects CIs, you can define complex rules for changing the severity value. For more information, see the Service Modeling Best Practices Guide.
Consider the following items:
The following table defines the impact ranges:
|
Impact |
Color |
Description |
|---|---|---|
|
0 |
Green |
Operational |
|
1-10 |
Yellow |
Slightly Degraded |
|
11-20 |
Orange |
Moderately Degraded |
|
21-30 |
Red |
Severely Degraded |
|
31-40 |
Burgundy |
Down |
The Topology tab of the Contents pane shows the impact color as a small box above and to the right of a service, CI, or group. Mouse over the box to display the impact value.
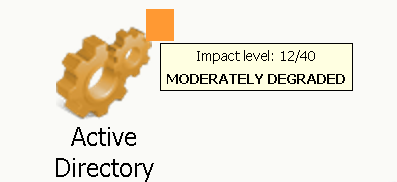
The impact number shows on the small box when you click Chart Display Complexity Level  and switch to the Advanced view.
The color of the service icons in the Operations Console indicates the quality impact of the service. Quality impact is the inverse value of service health, which displays on the Dashboard and the Component Detail pane of the Operations Console.
|
Copyright © 2013 CA.
All rights reserved.
|
|