

Once launch panels are set and you are connected, double-click the metric name or metric instance name you want to pass to the specified launch panel. Performance Manager displays this panel using the information passed.
For strip charts, digital meters, and bar graphs with one or more different metrics displayed (List of Metrics as the type), you can now launch the selected panel by double-clicking on the instrument title. For bar graphs that display multiple instances of a metric, for example, a bar graph of the CPU utilization for the top 7 users, you can double-click an instance identified by user name and have that name passed to the launched panel. The launched panel can then filter its displayed metrics based on the specific user.
See the section Assigning Metrics for information on metric filtering.
To disable panel launching, select the Remove Launch Panel menu item and click OK.
The following example illustrates progressive disclosure using panel launching:
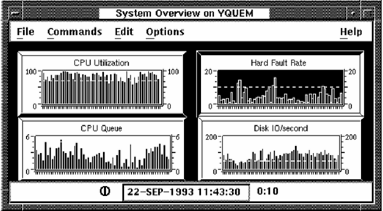
In the following example, double-clicking on the metric CPU Utilization instrument in the Performance Manager System Overview panel launches the CPU panel on node YQUEM. The node YQUEM and the current interval are passed to the panel CPU.
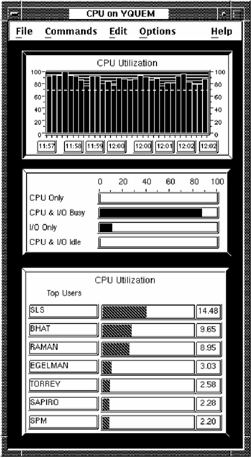
Double-clicking on the Top Users metric name SAPIRO launches the user CPU panel passing it the current interval, the node YQUEM, and the user name SAPIRO, as shown in the following screen:
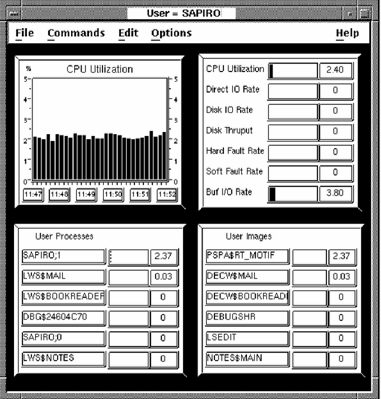
Each of the metrics in the panel are filtered by the user name SAPIRO. For example, the User Processes instrument is set up as follows:
The instrument's main metric is Process CPU Utilization sorted in ascending order. The metric is filtered by instance with a filter metric of user name. The filter compare value is left blank so the value is passed from the panel. The instrument's second metric is process name using an alias of User Processes.
|
Copyright © 2008 CA.
All rights reserved.
|
|