

You can set threshold values for strip charts and bar graphs to alert you to potential performance problems. When a threshold value is exceeded, the color of the indicator changes. For example, the CPU utilization threshold on the strip chart in the CPU panel is set to alert you when CPU utilization exceeds 70 percent. If the percent utilization exceeds 70 percent the bar on the strip chart changes from black to red for the period of time during which the threshold is exceeded.
To set a threshold value:
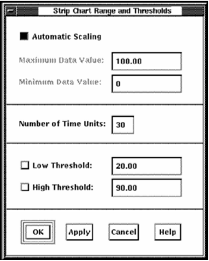
This dialog box is also used to set the scale for an instrument. The maximum and minimum data values to be displayed for the bar or strip chart can be set. In addition, the strip chart can be set to automatic scaling whereby the height of the chart is dynamically adjusted to match the largest data value shown.
The Ranges and Thresholds dialog box lets you set two levels of thresholds.
To modify a threshold value
The x-axis on the strip chart can be changed by specifying a new value for the Number of Time Units. This value, with the display interval, determines the amount of time represented on the strip chart.
To apply your changes
|
Copyright © 2008 CA.
All rights reserved.
|
|