

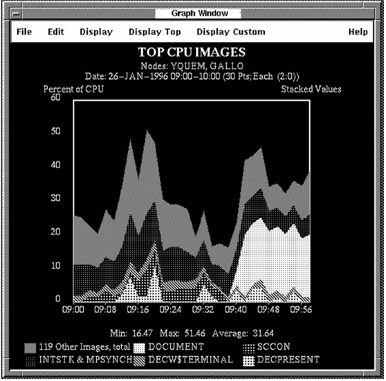
Pull down the Display Top menu to display graphs of top system use. Point to a Top menu item and click the submenu icon. Click a menu item in the submenu. The graph you have chosen is displayed, as shown in the following screen:
For more information on predefined graphs, see the chapter Evaluate Performance in Detail.
|
Copyright © 2008 CA.
All rights reserved.
|
|