

To view graphs or pie charts of selected data, release on the graph item of the Display menu. The Performance Manager Graph Window is displayed, as shown in the following screen:
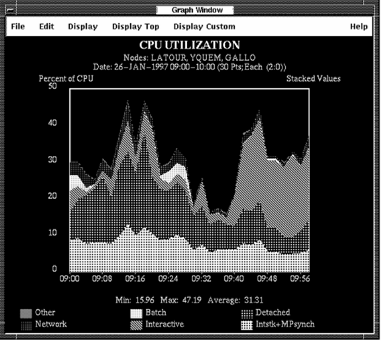
Each graph has the same basic format. The components are these:
The title is centered at the top of the graph and identifies the type of graph.
The subtitle gives the node name (or list of node names for composite graphs), the date and time of the selected data, the number of x-axis data points, and the time represented by each point.
Time is implied as the x-axis label. Labels on the y-axis specify the units of the plotted values, for example, “Percent of CPU.”
Axis markers indicate the magnitude and time of any point on the graph. The x-markers indicate the time. The y-markers are scaled based on the maximum value of all the data points.
The legend appears at the bottom of the graph. The legend identifies the name of the metric, and the color or pattern associated with it.
The Performance Manager Graph Window lets you do the following:
|
Copyright © 2008 CA.
All rights reserved.
|
|