

Pull down the Display Custom menu to display custom graphs. Choose the custom graph category that you want to select. Performance Manager interface displays a dialog box, as shown in the following screen:
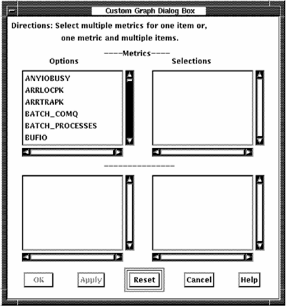
You can take the following actions in this screen:
For most custom categories, additional items appear in the lower option box. You can display up to six metrics when using system metrics. For other types of metrics you can display up to six metrics when one item is chosen and up to six items when one metric is chosen.
|
Copyright © 2008 CA.
All rights reserved.
|
|