

Release on the Performance Evaluation menu item from the Display menu to open the Performance Manager Performance Evaluation Window, as shown in the following screen:
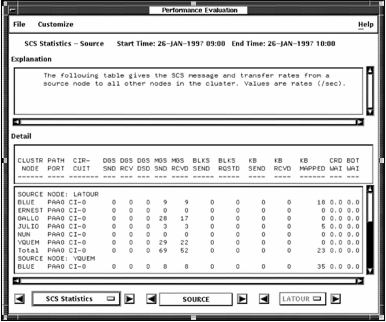
To navigate through the Performance Evaluation Report, click the Statistics label. An option menu appears listing all of the Performance Evaluation Reports. Release on the report section you want displayed. You can also advance through the report by clicking on the appropriate direction arrows.
The Section label, here labeled SOURCE, changes according to the report being viewed, and will be desensitized if irrelevant. The arrows on either side of this label allow you to advance to other sections of the report.
Press on the Node button and an option menu appears listing the nodes for which the report is available. Release on the node you want displayed. Only pool statistics are available by node.
To exit from the Performance Evaluation Window, pull down the File menu and release on Close.
To customize the Performance Evaluation Report, pull down the Customize menu and release on the menu item you want.
The Customize menu lets you alter the hotfiles report.
Release on the Set Hotfile limit... menu item to display the Set Hotfile limit dialog box containing a scale set at the current hotfile reporting count, as shown in the following screen:
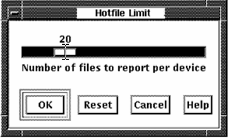
Drag the arrow to change the number of files that you want reported for each disk device.
|
Copyright © 2008 CA.
All rights reserved.
|
|