

Release on the Process Statistics menu item from the Display menu to open the Performance Manager Process Statistics Window, as shown in the following screen:
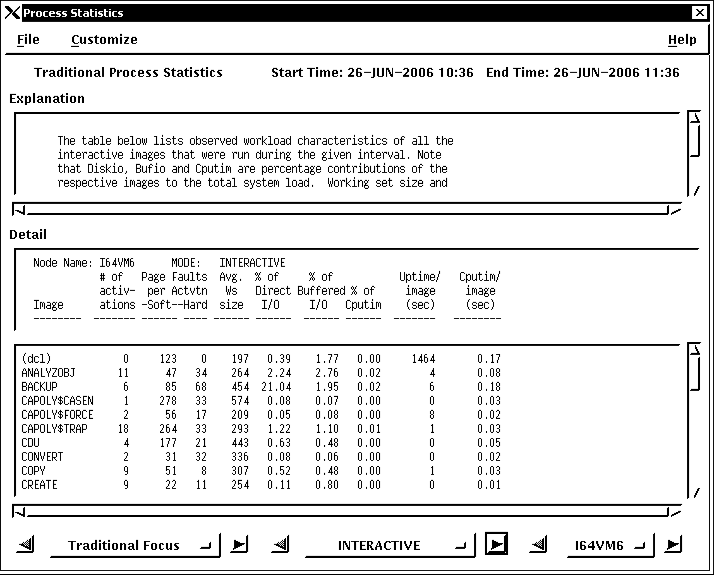
To navigate through the Process Statistics Reports, click the Traditional Focus label. An option menu appears listing all of the Process Statistics Reports. Release on the report type you want displayed. You can also advance through the reports by clicking on the appropriate direction arrows.
The Section label, here labeled INTERACTIVE, changes according to the report section being viewed, and will be desensitized if irrelevant. The arrows on either side of this label allow you to advance to other sections of the report.
Holding MB1 down on the section label will display all other available reports. Releasing MB1 on the desired report name will update the Detail window.
Press on the Node button and an option menu appears listing the nodes on which the report is based. Release on the node you want displayed.
To exit from the Process Statistics Window, pull down the File menu and release on Close.
To customize the Process Statistics Report, pull down the Customize menu and release on the menu item you want.
The Customize menu lets you enter any of the following:
Release on the Cluster stats by node menu item to turn on or off the reporting of cluster-wide process statistics by node.
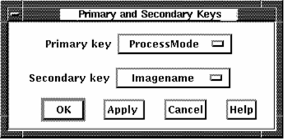
To re-sort the process data, release on the Report keys... menu item. Performance Manager displays the Primary and Secondary Keys dialog box.
The Primary and Secondary keys you specify are applied when you use the SAVE AS option to save process statistics, as shown in the following screen:
|
Copyright © 2008 CA.
All rights reserved.
|
|