

Enter any of the following information:
Hold MB1 down on any of the date and time fields to see all available choices. Release MB1 on the desired value. Press and hold MB2 to advance through the possible values. Press and hold MB3 to move back through the values.
These controls are desensitized if you have enabled the calendar option and have loaded a file of date ranges.
Press MB1 on the Set time option button and an option menu appears.
Enter any of the following options:
Performance Manager displays the Performance Manager Time Selection Box.
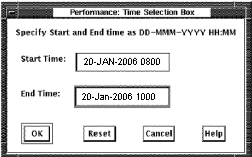
The day and time can be entered in the format shown in the window.
Clicking on the OK button applies the start and end times and removes the dialog box from the screen. The Reset button restores the start and end times to those displayed in the Performance Manager Data Selection box.
Clicking on the Cancel button removes the dialog box without changing the time fields currently displayed in the Data Selection box.
Specifies a subset of hours within your beginning and ending reporting period. Release on the Modify button and a Schedule Selection dialog box appears.
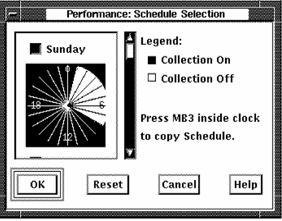
A 24-hour clock is displayed. A bar on the right side of the clock lets you scroll to each day of the week. By default, data collection is set ON for each hour of the day, every day of the week.
To set the clock:
To turn off data collection for a specific hour, point to the hour on the clock and click MB1. Holding MB1 down and dragging the pointer around the clock will set data collection to the value of the initial hour setting for a series of hours.
To duplicate a day's schedule:
The OK button removes the dialog box and applies the new schedule. Reset causes the schedule to revert to your previous selection. Cancel removes the Schedule Selection dialog box.
lets you specify a series of date ranges that are listed in a text file.
For example, if you wanted to generate graphs and reports for the all Mondays in January, but wanted to substitute a Tuesday for the Martin Luther King holiday, you could create a text file with the following entries:
04-JAN-2006 10:00, 04-JAN-2006 12:00
04-JAN-2006 14:00, 04-JAN-2006 16:00
11-JAN-2006 10:00, 11-JAN-2006 12:00
11-JAN-2006 14:00, 11-JAN-2006 16:00
19-JAN-2006 10:00, 19-JAN-2006 12:00
19-JAN-2006 14:00, 19-JAN-2006 16:00
25-JAN-2006 10:00, 25-JAN-2006 12:00
25-JAN-2006 14:00, 25-JAN-2006 16:00
The above date list indicates that the hours of 10 to 12 a.m. and 2 to 4 p.m. should be processed for the 4 days specified. Tuesday the 19th is processed in place of Monday the 18th, a holiday.
Release on the Modify button and a Performance Manager Dates File Selection box appears.
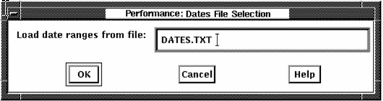
Enter the name of the file containing the date ranges and release on OK. When the dates are successfully loaded, the box is removed and the Start Time and End Time buttons are updated and desensitized. Click the Calendar button to turn off the Dates File.
Click Filter to select a subset of data for reporting and graphing. Click Modify to change the entries for filtering.
The Selection Filters dialog box lets you select a subset of the daily or history data for PA reports and graphs. Process data and disk data can be filtered.
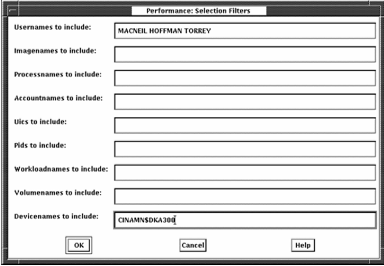
Process data can be filtered by using any of the filter entries: Usernames, Imagenames, Processnames, Accountnames, UICs, PIDs or Workloadnames. If a process record's identification information matches any of the identification specified, that record is selected. When using one or more of the process filters, the following PA reports and graphs include only information on the selected processes:
Likewise, disk data can be filtered by using any of the filter entries: Volumenames and Devicenames. If a device record's identification information matches any of the volume names or device names specified, that record is selected. When using one or more of the disk filters, the following PA reports include only information on the selected disks:
If you specify both a process filter and a disk filter, the hot file report section and hot file graphs will select only hot files that are both located on the specified disk volume, and used by the specified process. The same will be true for the User_Volume, Image_Volume, and Workload_Volume graphs.
The following entries allow you to select specific processes or disks for the reports and graphs:
Specify a list of strings (separated by commas, spaces or tabs) to generate reports and graphs for all process records with the username matching any of the specified strings.
Specify a list of strings (separated by commas, spaces or tabs) to generate reports and graphs for all process records with the imagename matching any of the specified strings. Do not specify any trailing ".EXE", nor the file version, device or directory.
Specify a list of strings (separated by commas, spaces or tabs) to generate reports and graphs for all process records with the processname matching any of the specified strings. The match string is case sensitive, so if the process names have any lower case letters, spaces or tabs, use double quotes when you enter the value; (for example,"--RTserver--").
Specify a list of strings (separated by commas, spaces or tabs) to generate reports and graphs for all process records with the accountname matching any of the specified strings.
Specify a list of strings (separated by commas, spaces or tabs) to generate reports and graphs for all process records associated with any of the specified workloads. This filter is valid only if the Classified By option is used to specify a classification scheme for your workload data.
Specify a list of UICs (separated by commas, spaces or tabs) to generate reports and graphs for all process records with the UIC matching any of the specified UICs. An asterisk may be used to wildcard either the group or user field of the specified UICs.
Specify a list of PIDs (separated by commas, spaces or tabs) to generate reports and graphs for all process records with the PID matching any of the specified PIDs.
Specify a list of strings (separated by commas, spaces or tabs) to generate reports and graphs for all disk records with the volumename matching any of the specified strings. Do not specify any trailing colon.
Specify a list of strings (separated by commas, spaces or tabs) to generate reports and graphs for all disk records with the devicename matching any of the specified strings. Do not specify any trailing colon.
|
Copyright © 2008 CA.
All rights reserved.
|
|