

Release on the Tabular report menu item from the Display menu to open the Performance Manager Tabular Report window, as shown in the following screen:
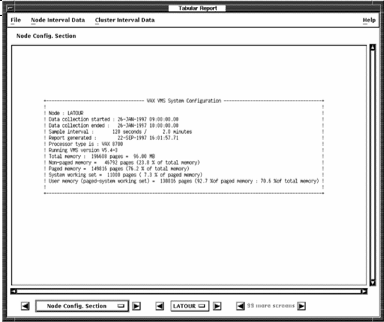
To navigate through the Tabular Report, click the arrow buttons on either side of the Configuration label. This updates the window with the Summary, Process, Extended Process, Disk, or Server Statistics sections for node reporting. Cluster-wide reports are also provided for summary, process, disk, and server reports which focus on either a cluster view or a by-node view. The window is sized to accommodate the requirements of the Summary Statistics display. The section label changes according to what section is currently viewed, as are the arrow buttons enabled or disabled.
Pressing the node button (labeled LATOUR in the figure) displays an option menu with the list of selected node names for which the report can be viewed. Releasing on a node name causes the report window to be updated with that node's data. The arrow buttons on either side of the node button can be used to progress sequentially through the selected nodes.
The node option menu and arrow buttons are not enabled while cluster reports are being viewed.
The process and disk report sections can generate many screens worth of data. When viewing these report sections the number of screens available for viewing and the arrow buttons on either side become enabled to allow reviewing all available data.
To exit from the Tabular Report Window, pull down the File menu and release on Close.
|
Copyright © 2008 CA.
All rights reserved.
|
|