

The Anomaly Trend view shows the value and probability of the anomaly over time. To display this trend chart, click a link in the Date column in either the Anomaly Drill-in view or the Enterprise-Wide Anomalies view. The following example shows an Anomaly Trend view in the CA NetQoS Performance Center Console.
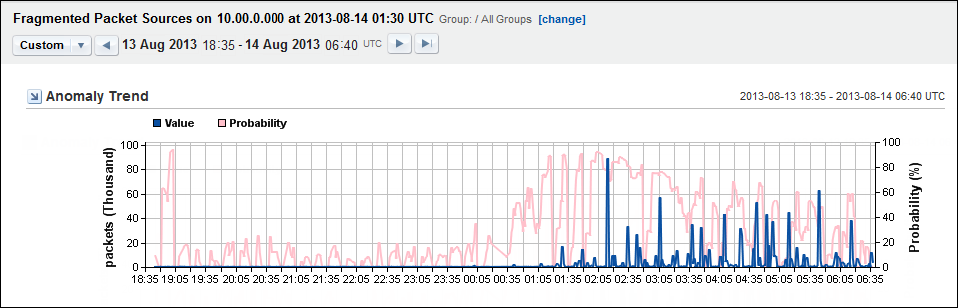
The view shows the pattern of deviation from normal network behavior. You can see when the behavior began and how severe the behavior was. A longer term view can help to determine patterns over days, weeks, or months.
The recorded values are shown as a blue trend line on the X-Axis. The probability that the behavior is a true anomaly is shown as a pink trend line on the Y-Axis.
You can edit the following view settings:
Note: If your deployment includes CA Performance Center, you can use the Zoom feature to interactively limit the time frame.
|
Copyright © 2015 CA Technologies.
All rights reserved.
|
|