

The Enterprise-Wide Anomalies view is a comprehensive summary of the anomalous behavior during the reporting time frame, with details about the anomaly type, location, and size.
This view is useful for beginning an investigation of problem behavior or for initiating troubleshooting procedures to stem an attack. The view provides more detailed information about the anomalies you see in other views. This view also identifies network locations to begin investigating.
You can edit the following view settings:
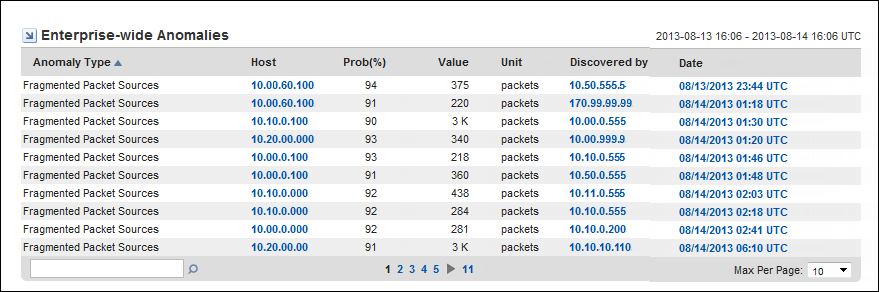
This view is not included by default on the Anomaly Detector page in the Performance Center Console. To see this view, add it to a page or to a new custom page. The graphic shows an example view in the CA NetQoS Performance Center Console.
The view provides the following information about anomalous network behavior:
The type of anomalous behavior. For a description of each anomaly type that you can enable for monitoring, see Sensors Overview.
The name or IP address of the host on which the anomalous behavior is detected. The host may be a client system, a server, a router, or an interface. The program attempts to resolve the hostname of any IP address and displays that name in this field.
The calculated likelihood that flagged packet flows are truly anomalous.
Probability is expressed as a percentage. For example, if the probability for an anomaly type is 91%, the packet flows that triggered the reported anomalous behavior are calculated to have a 91% probability of being truly anomalous. In this case, the packet flows have a low probability of occurring normally on this network.
For more information about the probability algorithm, see Probability Thresholds.
The date and time that the anomalous behavior is detected. The time may vary by up to 15 minutes from the time when the flows actually took place. Data is pulled from the Harvesters for analysis at 15-minute polling intervals.
|
Copyright © 2015 CA Technologies.
All rights reserved.
|
|