

Interface Reports › Interface Report Types › Growth Report
Growth Report
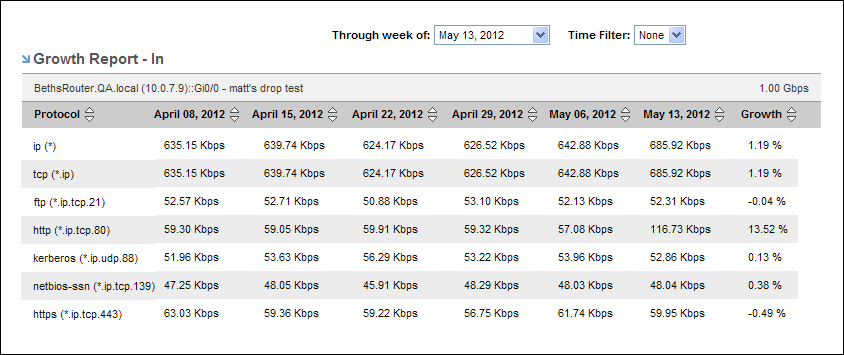
The Growth report provides historical growth statistics for the top protocols on the selected interface--so you can see which applications have increasing capacity needs. This knowledge helps you make decisions about adding capacity in the future.
This topic describes how to display a Growth report.
Follow these steps:
- Display an interface report in either of the following ways:
- Locate and click an interface on the Interfaces page.
- Click an interface link in an existing view--for example, on the Enterprise Overview page.
- Select Growth Report as the report type at the top of the page.
The report page is updated to show a Growth Report table.
- (Optional) Choose the direction of the traffic to display by using the Presentation options.
- Direction In: Show traffic that is inbound to the interface.
- Direction Out: Show traffic that is outbound from the interface.
- (Optional) Change the reporting time period:
- Select Last 6 Weeks (default setting) or Last 6 Months in the Presentation options.
- Last 6 Weeks: Sets the report to show six weeks of data. The six most recent weeks are selected by default.
- Last 6 Months: Sets the report to show six months of data. The six most recent months are selected by default.
- (Optional) Use the ‘Through week of’ or the 'Through month of' option to select an alternative ending week or month for the six-week or six-month time period.
- (Optional) Restrict the reporting range by selecting a time filter from the Time Filter option list.
Time filters are created by the Administrator for CA Network Flow Analysis. For example, the Administrator could create a time filter to restrict the report data to business hours and business days. If the Time Filter list is empty, your Administrator has not created any time filters.
Also See:
Set the Time Period for a Report
Copyright © 2014 CA.
All rights reserved.
|
|