

A Flows report is a trend plot that shows the rate of the flows that enter and leave the selected interface. A Flows report helps you find patterns or anomalies.
Viruses typically generate large increases in flow counts. The flow rate can indicate the load on the Harvester.
Follow these steps:
The report page is updated to show flow trend charts.
Rate (default setting) or Volume
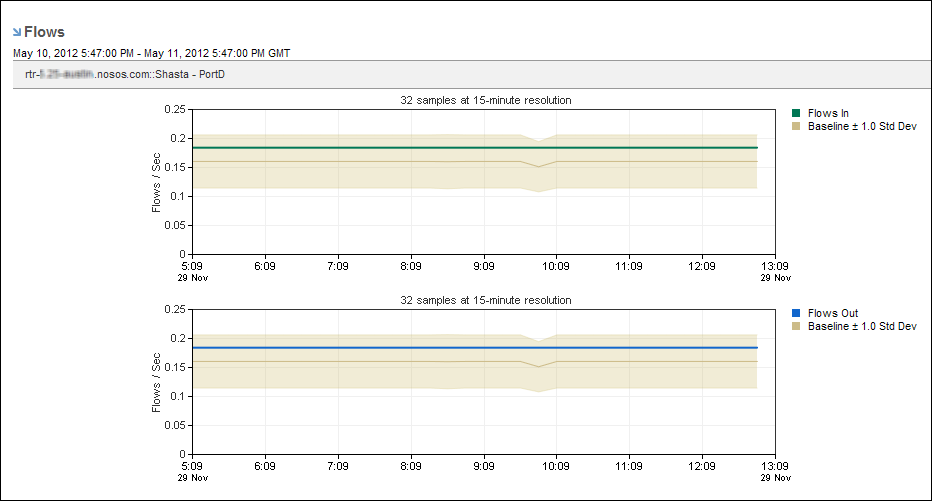
Each option displays trend charts of data that is inbound and outbound on the selected interface.
You can also select Show Baselines to view +/- 1 Standard Deviation. The baseline is computed by calculating the average and standard deviation for a maximum of 10 samples (the last six weeks and the last four days). This rolling baseline feature provides a visual representation of a current and historical trend overlay. When a current trend line is above or below the baseline, the performance is out of the norm. When the current trend is within the baseline, the performance is within the range of historical behavior.
The reporting period is the most recent 24-hour period by default.
The Top Flows by Interface view is displayed in the following Performance Center Console dashboards.
|
Copyright © 2014 CA.
All rights reserved.
|
|