

Views in Performance Center › CA Network Flow Analysis Views in CA Performance Center › Interface: Stacked Trend Charts › Stacked Protocol Trend
Stacked Protocol Trend
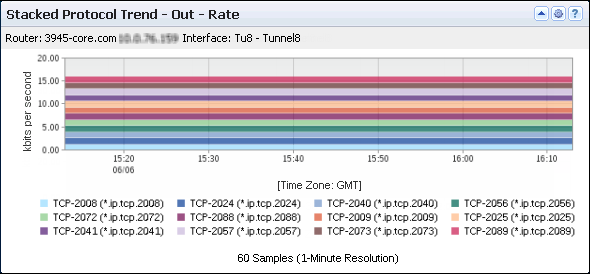
The Stacked Protocol Trend views in the Performance Center Console show the protocols that are used the most heavily for traffic on the selected interface. The views also show when the traffic occurred.
The example graphic shows a Stacked Protocol Trend view in the CA Performance Center Console. A timeline of rates is included for each listed ToS value. You can configure the view to display rate, utilization, or volume information.
The views include the following information:
- Identifier
-
Identifies the interface that is used for the report. The identifier string consists of the router name, interface name, and interface description (under the view title).
(NPC) The identifier line also includes the interface speed.
- Protocol Bands
-
Show the data rate, the data volume, or the interface capacity utilization for each top protocol that is associated with traffic on the interface.
- Time (All Views)
-
Point in time during data transmission--expressed in hours and minutes (X-Axis).
- Measurement Setting:
-
- Rate: Data rate at each point in time expressed in kilobits per second, for example (Y-Axis). The rate is calculated by dividing the data volume by the elapsed transmission time.
- Bytes (Volume): Data volume at each point in time expressed in kilobytes, for example (Y-Axis).
- Percent (Utilization): Percentage of the total interface capacity that the protocol uses (Y-Axis). The utilization percentage is calculated by dividing the data rate by the data speed.
Depending on the data direction, the view shows inbound, outbound, or total data on the interface.
- Legend
-
Identifies the protocol for each color band by protocol keyword and tcp/udp port (bottom of the view).
Performance Center views show the data from the time range that is defined for the page.
Opening the Views
To see these views in the Performance Center Console, go to one of the following locations:
- (CA PC) Interface Pages (with an interface selected): Custom dashboard; IP Performance and CBQoS tabs
- (NPC) Interface Pages (with an interface selected): Interface Capacity, Interface QoS, and custom tabs
Note: You can add Multi-Interface Stacked Protocol Trend views to a custom dashboard or to a custom tab in the Interface pages in the CA NetQoS Performance Center Console. This view consists of a group of interface-specific stacked protocol trend charts
Available Actions
You can perform several actions in this view, including the following ones:
- Change the traffic direction, the type of measurement (Rate, Volume, or Utilization), and the view name by editing the view settings. If the view is on a custom interface context dashboard in the CA Performance Center Console, you can change the interface.
- (CA PC) Zoom in to narrow the time frame.
- (CA PC) Display only the data for a single protocol: Right-click a protocol in the legend at the bottom of the view and click Focus. This menu is available for a view that has multiple protocols. (This option is active when the legend contains multiple protocols.)
- (CA PC) Hide data for one of multiple protocols: Right-click a protocol in the legend at the bottom of the view and click Hide.
- (CA PC) Position your cursor over legend items to display explanatory Tooltips.
- Jump to details on an NFA console Interface page by double-clicking a protocol in the legend.
- (NPC) Jump to details on the corresponding Interface page by double-clicking a protocol band in the view. To choose a destination tab on the Interface page, right-click the protocol band and select a tab from the menu.
Find Protocol Trend Data in the NFA Console
You can display protocol volume in the NFA console in trend charts or stacked trend charts for a selected interface:
- Overview -- Report type: Overview. Presentation menu options: Mixed Chart; Volume.
Views: Stacked Protocol Trend (In and Out) for the Top N Protocols, plus other overview views.
- Top N Protocols, Stacked Trends -- Report type: Protocols. Filter: Top N Protocols. Presentation menu options: Stacked Trend Chart; Volume.
Views: Stacked Trend for the Top N Protocols (In, Out, and Total).
- Top N Protocols, Trends -- Report type: Protocols. Filter: Top N ToS. Presentation menu options: Trend Chart; Volume.
Views: Trend (In, Out, and Total) for each of the Top N Protocols.
- Single Protocol -- Report type: Protocols. Filter: Single protocol.
Views: (Depending on the selected report subtype): trends, stacked trends, trend summaries, and multi-trend summaries for protocols, protocol hosts, and protocols in conversations.
To display Flow Forensics-level detail, click the Flow Forensics link and run a Flow Forensics report.
Also See:
Top Protocols (Table)
Top Protocols (Pie)
Top Protocols (Bar)
Copyright © 2014 CA.
All rights reserved.
|
|