

|
|
|
A Flows report presents a trend plot with information about all the flows that enter and leave the selected interface. A Flows report helps you find patterns or anomalies.
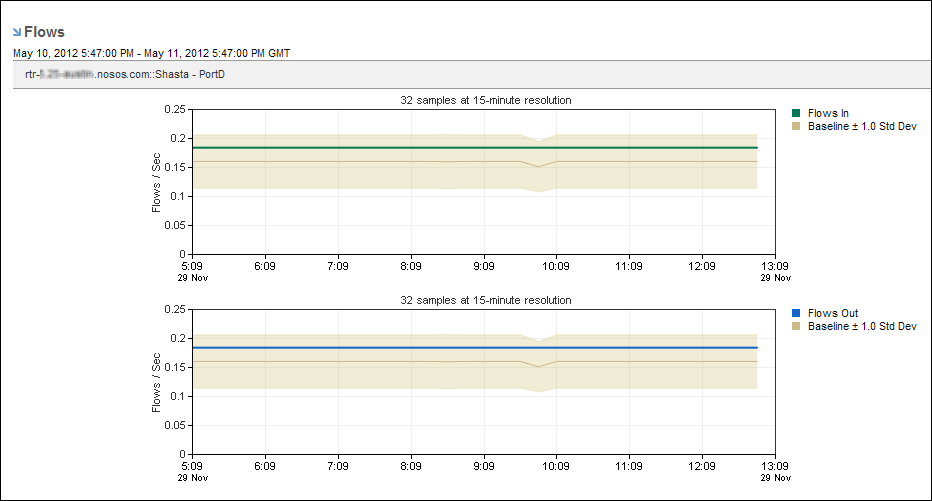
Flows do not always equate with traffic volume or traffic rate. A flow can represent a single packet, or it can represent a 1-MB flow of data that occurred during a 1-minute interval. Flow rate can indicate the load on the Harvester, however. Viruses typically generate large increases in flow counts.
To display a Flows report, start from an interface report.
Follow these steps:
The report page is updated to show flow trend charts.
Rate (default setting) or Volume
Each option displays trend charts of data that is inbound and outbound with respect to the selected interface.
You can also select Show Baselines to view +/- 1 Standard Deviation. The baseline is computed by calculating the average and standard deviation for a maximum of ten samples (the last six weeks and the last four days). This rolling baseline feature provides a visual representation of a current and historical trend overlay. When a current trend line is above or below the baseline, the performance is out of the norm. When the current trend is within the baseline, the performance is within the range of historical behavior.
The reporting period is the most recent 24-hour period by default.
| Copyright © 2012 CA. All rights reserved. | Tell Technical Publications how we can improve this information |