

From the Suites/Tests pane, click a test case name to show details about the execution of that test case. The Status tab displays.
Test Cases with More than One Cycle
For a test case that has more than one cycle, the Cycles results are displayed, showing the status of each cycle.
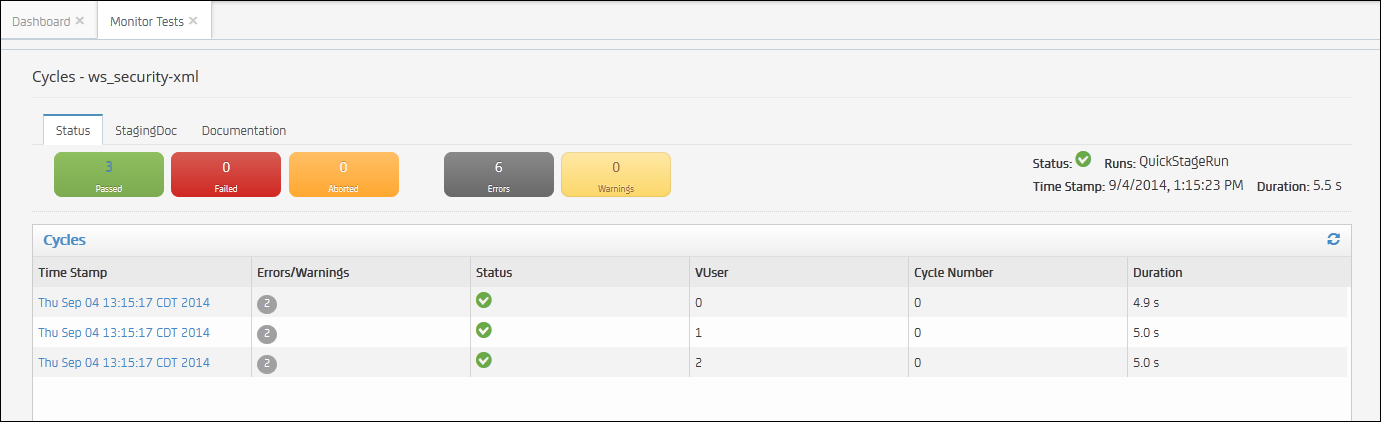
The following fields are displayed for each cycle:
Displays the start date and time for each cycle in the test case.
Shows the number of errors (shown on a gray circle) and warnings (shown on a yellow circle) for each test case and test suite.
Indicates the status of the test case or test suite: Passed, ![]() Failed
Failed ![]() , Aborted
, Aborted ![]() , or Running
, or Running  .
.
Shows the number of virtual users for each cycle.
Displays an index of cycle runs. If there is only one cycle in the test run, Cycle Number is 0.
Shows, in seconds, the duration of the execution of the test case or test suite.
Cycle Details
To display cycle details, perform one of the following actions:
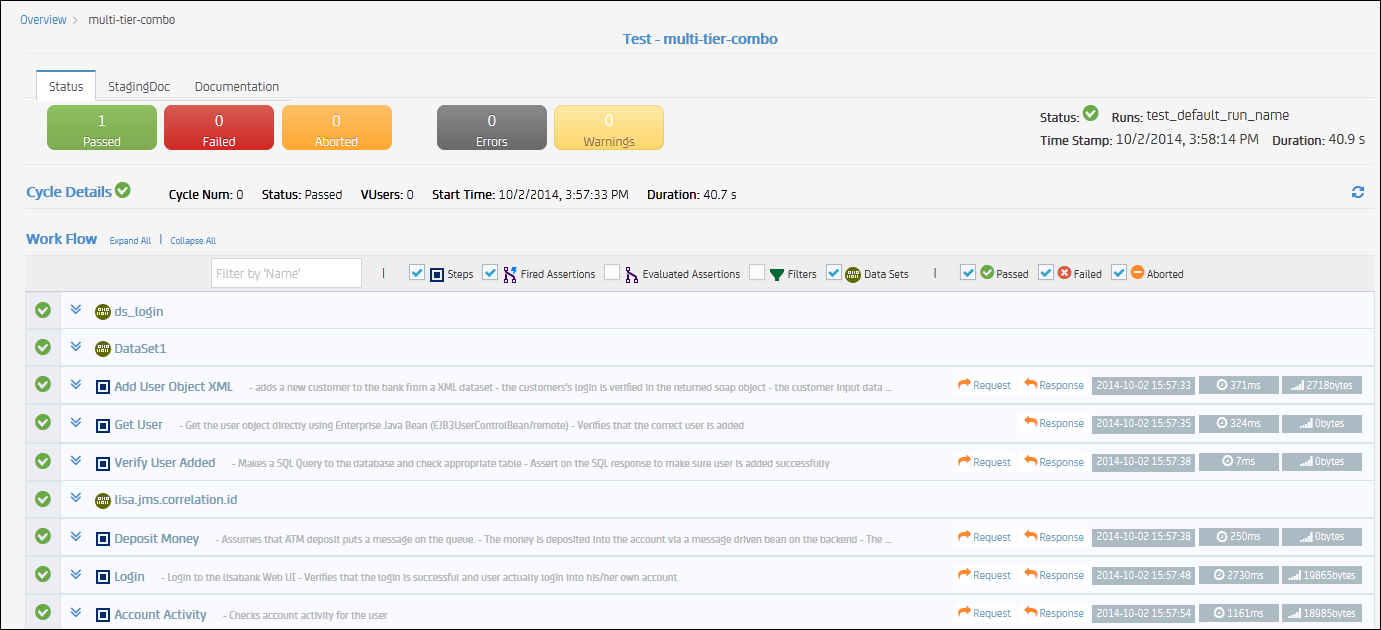
Each test step in the test case displays. All data sets, filters (global and nonglobal), and assertions (global and nonglobal) that are associated with each step also display.
To expand all the steps in the rest case, click Expand All. To collapse all the steps, click Collapse All.
To the left of each element name, an arrow ![]() displays. To display detailed information about the element, including request/response, events, errors or warnings, and properties, click the arrow.
displays. To display detailed information about the element, including request/response, events, errors or warnings, and properties, click the arrow.
If a step produced errors or warnings, the number of errors and warnings displays in a gray circle (for errors) or orange circle (for warnings) to the right of the step name. Mouse over the number to show the error or warning text.
If a step has a request and response, click Request  or Response
  to display the request or response details.
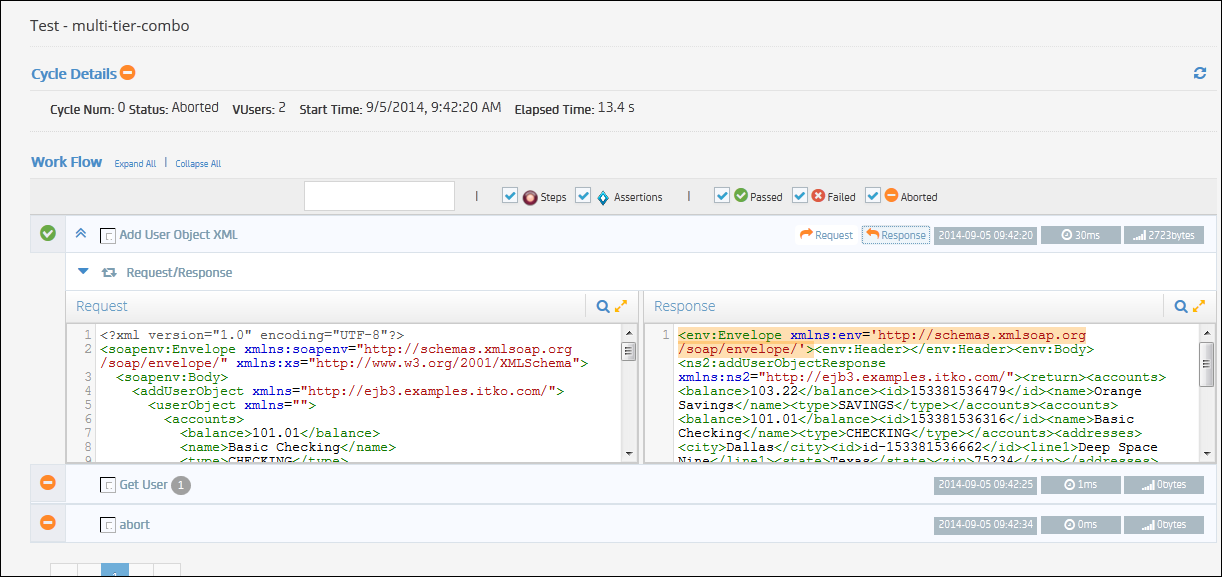
To search the text of a request or a response, click Search  . Enter a query string and click Enter.
Note: If you do not see events or properties for a step that had events or properties, inspect the staging document for that test to be sure that it is set to record events, requests, responses, screenshots, and properties that are set or referenced. You can use the Run1User1CycleShowAll staging document to ensure all is captured.
To expand the view of a request or a response, click Expand ![]() .
.
To view the staging document that a test uses, click the Staging Doc tab.
To view documentation that is associated with a test, click the Documentation tab.
|
Copyright © 2014 CA Technologies.
All rights reserved.
|
|