

|
|
|
The status field for work list entries that have been processed is marked ANALYZED. You can review the compression analysis results from either of two perspectives. By reviewing the work list, you see the test compression percentage achieved by one of the compression algorithms for each data set analyzed. To see the results for all algorithms for a given data set, you can focus on that data set with the Browse function.
View Function—by default, the test compression percentage displayed in the work list is for the Super Express algorithm. You can use the View function to change the default algorithm for the work list. After a data set is implemented the routine name does not change.
The View function does not influence implementation, which you must specify through implementation line commands. View affects only the display.
To change the default algorithm, select the View action item.
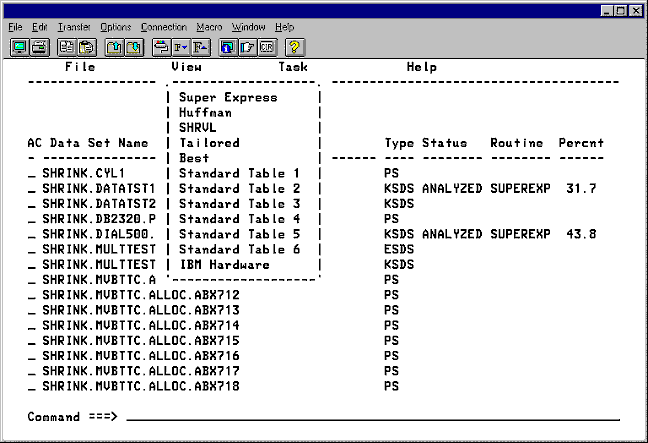
Select the option from the menu for the compression algorithm that you want displayed for each list entry. The compression percentage for the selected algorithm is displayed for each analyzed data set. The routine and percent for implemented data sets do not change. Also, the percent figure remains at zero for data sets that have not been analyzed. The previous panel shows the work list displaying the compression percentage for the Huffman algorithm.
Selecting Best displays the compression percentage for the algorithm or routine that achieved the best results.
Browse Function—you can see all of the analysis results for a given data set by using the b Browse line command function. To display the Browse panel for a data set enter a b in the line command field of the work list entry for that data set. Press Enter to display the Browse panel.
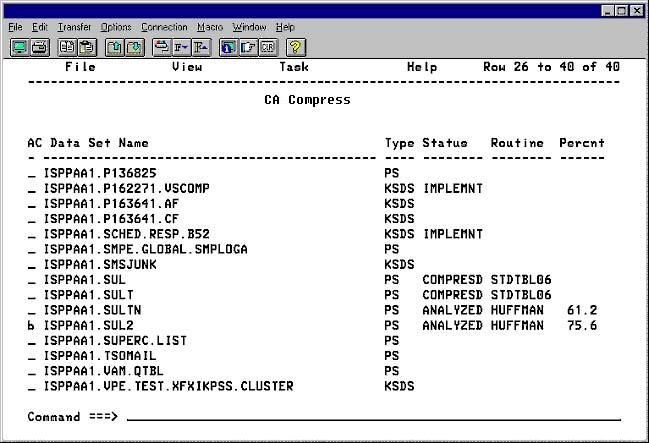
The Browse panel shows information about the data set and a comparison of five compression routines: the best of Standard Tables, Super Express, SHRVL, Huffman, and Tailored RDL. The following panel shows the Browse panel for the data set selected in the previous panel. The list following provides details about the fields displayed in the Browse panel.
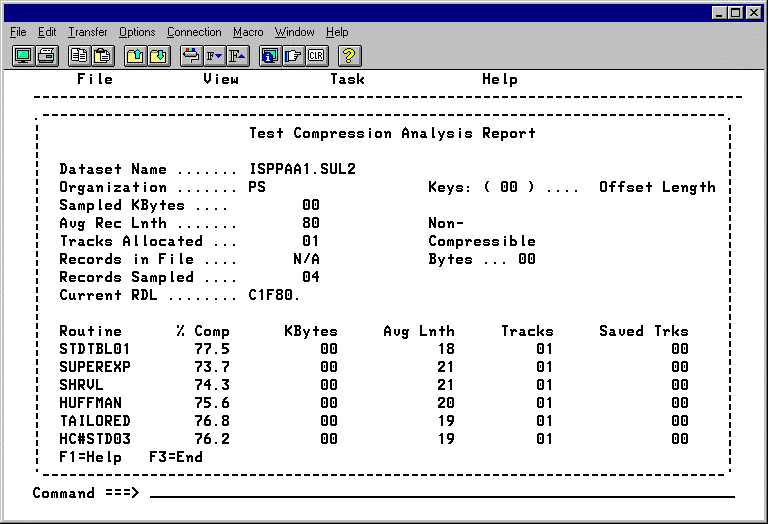
The following section describes the field names displayed in the Browse panel and the contents.
The data set name being analyzed.
Data set organization (KSDS,ESDS,PS).
Number of keys in the record.
Number of KB of sampled data.
Average record length before compression.
Number of noncompressible bytes.
Number of tracks allocated before compression.
Number of records in the file for VSAM files only.
Number of records sampled.
Current Record Description Language.
Name of the compression routine used.
Estimated percentage of file compressed.
Estimated KB used after compression.
Estimated average record length after compression.
Estimated number of tracks used after compression.
Estimated number of tracks saved after compression.
| Copyright © 2012 CA. All rights reserved. |
|