

Creating a portfolio of investments includes the following tasks:
Example: Creating IT Portfolios for Annual Planning
Vicki is the IT Operations Manager responsible for creating and maintaining the IT investments for the CIO at Forward Inc. Vicki is preparing for annual planning and has to create an IT investments portfolio to reflect existing work and proposed work. Vicki creates the portfolio as follows:
The following diagram describes how the portfolio manager creates a portfolio of investments:
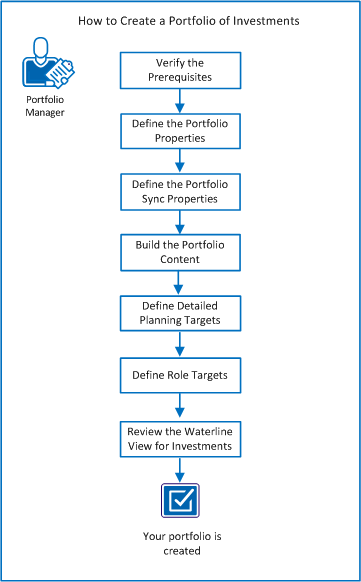
To create a portfolio of investments, perform these steps:
To create a portfolio of investments, complete the following requirements:
Note: For more information about creating investments, see the Project Management User Guide. For more information about creating ideas, see the Demand Management User Guide.
To start the portfolio creation process, define the high-level properties of the portfolio. These properties set the time, monetary, and resource boundaries of the portfolio within which you can plan and manage your investments. You can create multiple versions of a plan within these boundaries for comparison purposes and can implement the best plan.
For example, the following portfolio properties show how to use a data range to plan for your portfolio investments within that range:
Follow these steps:
Identifies the portfolio owner or creator, typically an operations manager, or director. The owner is automatically assigned view and edit rights to the portfolio and its content. You can select more than one owner for a portfolio.
Identifies a stakeholder in the business who wants to review the portfolio content and provide feedback. The stakeholder is automatically assigned view rights to the portfolio and its content. You can select more than one stakeholder for a portfolio.
Specifies the planning range of data for the portfolio. The data within the portfolio is clipped to stay within this set horizon. If an investment starts within the portfolio horizon but finishes after the horizon, you can analyze costs for the investment from both the following perspectives:
For example, an investment has a total cost of $10 million but you plan to spend only $2 million within the portfolio horizon. In this case, the portfolio surfaces both the total cost and the planning horizon costs of the investment.
Specifies the default view or page layout for the portfolio. If you have installed the PMO Accelerator add-in, you can change this default view to PMO-Portfolio Investment Dashboard.
Specifies the portfolio currency. In a multi-currency situation, the portfolio currency sets a default preference for reporting investments of differing currencies in aggregate. The financial data for both budget (cost) and benefit are rolled up in this portfolio currency. If your product is configured for a single currency, you cannot edit this value.
Defines the resource unit (hours or FTE) for measuring resource capacity for investments in the portfolio. You can set this unit only once for a portfolio.
Specifies how often to refresh the portfolio data and associated plans with actual investment data. This field appears after you define the initial portfolio properties. You can set up a sync schedule to refresh the portfolio automatically or you can sync the portfolio data manually.
Displays the total cost that the portfolio is targeting to spend during the planning horizon. This target is an aggregate of the capital and operating costs so you cannot set it directly.
Specifies the capital cost that the portfolio is targeting to spend during the planning horizon.
Specifies the operating cost that the portfolio is targeting to spend during the planning horizon.
Defines the portfolio currency or the currency in which you want to account for all investment cost and benefit amounts. In a multi-currency setup where portfolio investments use different currencies, all costs and benefits are rolled up in the portfolio currency.
Specifies the total benefit that the portfolio is targeting to gain during the planning horizon.
Defines the effort that the portfolio is targeting to use during the planning horizon.
Specifies the unit in which you want to represent the roles target. Select one of the following units:
The portfolio data represents a snapshot of the actual investment data in real time. You can update the portfolio data with the actual investment data by running a sync job. Syncing is important because portfolio stakeholders want to know how current the data they are reviewing is. To establish how often you want to refresh the portfolio data, define the properties of the sync job.
Based on how often you review the latest portfolio data, run the sync job manually anytime you want or set up a sync schedule. You can set up a sync schedule to refresh the portfolio automatically at a recurring time interval such as weekly.
Example: Setting Up a Portfolio Sync Schedule
Mary, the IT portfolio manager at Forward Inc. presents at the weekly stakeholders meeting every Monday. Mary covers all months in the portfolio planning calendar. To prepare for this meeting, Mary sets up the sync schedule to run every Sunday of every month at 9:00 A.M. The sync job populates the portfolio with the latest data from the actual investments. Mary then reviews the data and prepares the highlights for the meeting the next morning.
Follow these steps:
The portfolio sync properties appear.
Defines the frequency at which you want to sync the portfolio. You can select one of the following options:
When you return to the portfolio properties, the Manual link next to Sync Schedule has now changed. The link now reflects the new sync schedule that you just set up. To change a schedule, click the link again. You can see the date when the portfolio was last refreshed.
Add the investments to your portfolio that you want to monitor, track, and plan for at a high level. As you build the portfolio, you can preview the content. Previewing helps you understand what is included in the portfolio as you are building it.
Note: The limit for the number of investments that you can include in a portfolio is 100. The limit for the number of roles you can include in a portfolio is 25. These limits helps ensure better performance when you work with a portfolio.
The Database Administrator can change the limits to the portfolio content. Any changes to the limits can potentially impact the application and database performance. Before introducing a change in a production environment, thoroughly test the changes in a staging environment.
Example: Building Your Portfolio Content
Max the IT portfolio manager at Forward Inc., builds the portfolio content by including the following investments:
Max uses the power filter available in the Contents Editor to create the following expression so that only active ideas are included in the portfolio:
idea.is_active == 1
Max uses the power filter to create the following expression so that only active projects, not designated as templates are included in the portfolio:
project.is_active == 1 && project.is_template == 0
Follow these steps:
Note: Limit the number of investments for each investment type by using the Power Filter. Filter on any attribute that is associated with an investment type. For example, for the Project investment type, set the power filter to filter on and include only active projects. To add individual investments to the portfolio without setting the power filter, use the Individual Investments section.
Depending on the size of the portfolio, the sync job can take some time to run.
All investments included or added individually to the portfolio are listed in the Investments tab.
You can view, edit, and distribute the high-level portfolio targets for cost, resource, and benefit in a time-scaled view. These period-based targets show up on the Waterlines view where you can analyze your portfolio performance.
Set these detailed targets either as part of the initial portfolio creation process or later when you have added content.
Typically, you set targets at a high level while creating the portfolio. Later, as you add content, you can provide more details for these targets using the following methods:
Note: As you edit the targets, affected cells are flagged with a red, pending edits flag. The flag appears on the top left corner of the cell. To make the edits permanent, save them. The Save button is only active when there are changes to the page.
The planning periods that you see on the time-scaled view are based on the time period setting you configure on the Waterlines view.
Example: Providing Details for the Cost and Benefit Targets
Vicki, the IT Investments portfolio manager at Forward Inc., initially populates the cost and benefit targets in the portfolio properties. On the Targets page, the total and distributed values for cost and benefit are automatically created based on the values on the Properties page. Vicki fine-tunes the distribution by manually tweaking the values in each cell.
Follow these steps:
Specifies the aggregated planned cost for the portfolio investments including capital and operating costs. You initially define this value in the portfolio properties as an aggregate of the capital and operating costs. You can edit this value when providing details for the targets.
Displays the planned cost for the portfolio investments as it scales over time (weekly, monthly, quarterly) within the portfolio horizon.
Displays the difference between the distributed and approved target amounts.
Specifies the planned cost for the portfolio investments as an aggregate of the distributed amounts. To distribute the total amount uniformly across the portfolio planning periods, enter an amount in this field.
Specifies the aggregated planned benefit for the portfolio investments including capital and operating benefits. You initially set this value in the portfolio properties but you can edit it here too.
Displays the planned benefit for the portfolio investments as it accrues over time within the portfolio horizon.
Displays the difference between the distributed and approved benefit amounts.
Specifies the planned benefit for the portfolio investments as an aggregate of the distributed amounts. To distribute the total amount uniformly across the portfolio planning periods, enter an amount in this field.
Specifies the planned resource capacity in hours or FTE units for the portfolio investments over time (weekly, monthly, quarterly) within the portfolio horizon.
Displays the planned roles for the portfolio investments as it accrues over time within the portfolio horizon.
Displays the difference between the distributed and approved target amounts for the resource target.
Specifies the planned effort for the portfolio investments as an aggregate of the distributed amounts. To distribute the total amount uniformly across the portfolio planning periods, enter an amount in this field.
When you create a portfolio, you typically provide an overall target for effort in hours or FTE units. As you build the portfolio content, you can view, edit, and distribute this high-level target in a time-scaled view. You can define the role constraint in the following ways:
Example: Define Role Target
Vicki creates a portfolio for application sustainment for the following year. The resources are estimated to spend 20 percent of their time on sustainment for the following year. To set a role target for the portfolio, Vicki sorts the overall portfolio resource capacity in the following manner:
With the role planning framework set-up, Vicki proceeds to edit or populate values for each period.
Follow these steps:
After building the portfolio content and defining targets, use the default Waterlines view to see how the planned targets align with the portfolio investments.
By default, the approved investments with the most recent finish dates sort to the top of the list. The unapproved investments with later finish dates sort to the bottom of the list. You can change this default ranking either by dragging and dropping or by setting up rule-based ranking.
The Waterlines view can help you understand the following aspects of your portfolio:
As you review data, use the Waterline view as a "what if" environment to manipulate the items on the list and view the impact. You can also review the effects of the changes on the portfolio targets. For example, drag a time line to move out an investment start date and see its impact on the budget by time period. You can affect the portfolio in the following ways:
Follow these steps:
Note: For information about configuring the Waterlines view to see the fields you want, see the scenario named How to Configure the Waterline View.
|
Copyright © 2013 CA.
All rights reserved.
|
|