

As a system administrator, you monitor system performance to ensure optimal productivity for your users. CA Chorus offers various tools to help you monitor performance, including the Alerts module, Metrics panel, and the Policy Status Light module.
This scenario shows how an administrator configures the Policy Status Light module to monitor the memory usage of a server. A low-memory condition can cause unexpected program behaviors. By monitoring the usage, you can intervene before a low-memory condition causes problems.
To monitor performance, you need policies that identify the area to monitor and thresholds that indicate an important change in your data. A policy is the rule to evaluate a data point in an object against a user-specified value. Policy defines the actions to be executed on the successful evaluation of the rule.
Example:
Your server object has memory usage as the data point. You can define policies to change the colors in the Policy Status Light module when the memory usage reaches 85 percent and 95 percent. Monitoring memory usage at 85 percent and 95 percent requires two different policies. If these policies are not available, you must create them. You link these policies to the Policy Status Light module, which can help you monitor the health state of your server by displaying green, yellow, or red backgrounds to alert you to perform changes. From this module, you can see issues as they arise, investigate them, and identify root cause.
The following illustration shows how a system administrator configures the Policy Status Light module. This scenario uses this memory usage example to illustrate how to configure this module.
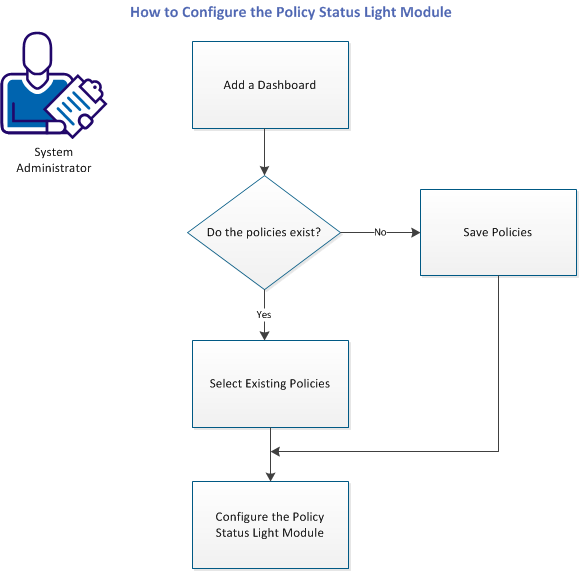
To monitor the memory usage, complete the following tasks:
|
Copyright © 2014 CA Technologies.
All rights reserved.
|
|