

CA APM メトリック › その他のメトリック › アプリケーション問題切り分けマップ メトリック
アプリケーション問題切り分けマップ メトリック
問題切り分けマップ ツリーの以下のメトリックは、MOM およびコレクタ Enterprise Manager の特定のコンポーネントおよびセグメントの情報を示します。 これらの数値により、アプリケーション問題切り分けマップに関連する Enterprise Manager および APM データベースの使用オーバーヘッドが参照できます。 これらの新しいメトリックは以下のとおりです。
- ApplicationTriageMap|TransactionSegmentsReceived
-
前回の収集期間にエージェントによって記録され、コレクタに送信されたセグメント数の集約。 このメトリックは、前回の収集期間に APM データベースの更新または挿入に費やされた時間を割合で示します。 ただし、収集期間自体に時間は加算されず、APM データベースおよびシステム全体の負荷が示されるのみです。
- ApplicationTriageMap|ProcessingTime|TransactionSegment(ms)
-
前回の収集期間にシステムがトランザクション セグメント情報を記録し、それを Enterprise Manager に送信してデータベースに保存するのにかかった時間(ミリ秒)の集約。 このメトリックはコレクタ Enterprise Manager にのみ適用されます。
- ApplicationTriageMap|ProcessingTime|TransactionComponent(ms)
-
前回の収集期間にシステムがトランザクション コンポーネント情報を記録し、それを Enterprise Manager に送信して APM データベースに保存するのにかかった(ミリ秒)の集約。 このメトリックはコレクタ Enterprise Manager にのみ適用されます。
- ApplicationTriageMap|TransactionComponentsReceived
-
前回の収集期間にエージェントによって記録され、コレクタに送信されたコンポーネント数の集約。 このメトリックは、前回の収集期間に APM データベースの更新または挿入に費やされた時間を割合で示します。
EJB
Enterprise Java Beans (EJB)がアーキテクチャの一部である場合、以下のタイプになります。
- EJB entity
- EJB session
- EJB message driven
これらの各タイプについて、以下の 2 つのメトリックが表示されます。
- Average Method Invocation Time (ms)
- Method Invocations Per Interval
EJB タイプの下に子ノードとして表示される、各 EJB の実装(クラスまたはメソッド)に関して、Enterprise Manager は 5 つの基本的な CA Introscope® メトリックをレポートします。
- Average Response Time (ms)
- Concurrent Invocations
- Errors Per Interval
- Responses Per Interval
- Stall Count
詳細:
5 つの基本的な CA Introscope® メトリック
Servlets
サーブレット ノードは、一般的に Enterprise Manager により監視されるアプリケーションにより呼び出される各サーブレットの 5 つの基本メトリックを表示します。
- Average Response Time (ms)
- Concurrent Invocations
- Errors Per Interval
- Responses Per Interval
- Stall Count
詳細:
5 つの基本的な CA Introscope® メトリック
JDBC
JDBC ノードは一般的に、Enterprise Manager により監視されるアプリケーションにより呼び出される JDBC コールのメトリックを表示します。
Averae Result Processing Time (ms)
クエリの応答が得られるまでの時間の平均をミリ秒で表します。間隔全体にわたり平均が求められます。
Queries Per Second
このクエリが各間隔あたりに発行された回数。
たとえば、JDBC プロトコルを使用して、個々の SQL シリーズのパフォーマンスを監視するように、エージェントを設定できます。 メトリック パスは、以下のようになります。
*スーパードメイン* | <ホスト名> | <プロセス名> | <Agent 名> | JDBC | SQL | [動的|静的] | クエリ | <SQL クエリ>
下の図は、実行された各クエリに対してこれらのメトリックがレポートされる方法を示します。
![この図は、メトリック ブラウザ ツリーの[JDBC]ノード下の階層を示しています。](o1471087.png)
Connection Count
間隔ごとの JDBC 接続の数。
Commit Count
エージェントが開始してからのコミット数の累計。
Commits Per Second
15 秒の間の 1 秒ごとのコミット数の平均。
JSP(JAVA サーバ ページ)
Average Response Time (ms)
JVM ですべての JSP が実行する _jspService() メソッドの平均応答時間。 すべての個々の JSP の応答時間の平均が求められて、この値が計算されます。
Responses Per Interval
過去 15 秒間に JVM ですべての JSP が実行した _jspService メソッドで、完了した呼び出しの数。
Average Response Time (ms) by class name
クラス名により識別される JSP の平均応答時間をミリ秒単位で表したもの。 _jspService() メソッドの各呼び出しでの時間が測定され、平均が計算されてこの値が求められます。
Responses Per Interval
直前の 15 秒間にクラス名で識別された JSP _jspService() メソッドで、完了した呼び出しの数。
Responses Per Second
JVM ですべての JSP が実行する _jspService() メソッドが完了するレート。
Responses Per Second by class name
特定のクラス名で識別される JSP の _jspService() メソッドの呼び出しが完了するレート。
Stalled Methods by class name and by method name
_jspService() メソッドの実行を完了するために、定義されたしきい値よりも長い時間がかかる JSP の数。
Concurrent Invocations
_jspService() メソッドを実行中のスレッドの数。
JSP タグ ライブラリ(JSP TagLi)
タグ ライブラリは、カスタム アクションを起動する JSP ページで使用されるカスタム タグの集合です。 カスタム アクションは JSP 仕様向けの 6 つの標準アクションのセットに含まれていない任意のアクションです。 カスタム アクションにより起動されるタスクの例として、データベース、電子メールおよびフロー制御などの外部システムにアクセスするフォーム制御が挙げられます。
以下のメトリックが JSP タグ ライブラリで使用可能です。
- Average Method Invocation Time (ms)
- Method Invocations Per Interval
- Average Method Invocation Time (ms) by class name and method name
- Method Invocations Per Interval by class name
- Method Invocations Per Interval by class name and method name
- Method Invocations Per Second
- Method Invocations Per Second by class name
- Method Invocations Per Second by class name and method name
- Concurrent Method Invocations
- Concurrent Method Invocations by class name
- Concurrent Method Invocations by class name and method name
- Stalled Methods over 30 seconds by class name and method name
- Average Method Invocation Time (ms)
JSP IO TagLibrary
- Warning Count
- Exception Count
RMI(リモート メソッド呼び出し)
リモート メソッド呼び出しは、分散 Java オブジェクトのメソッドの呼び出しです。つまり、複数のホストにある Java オブジェクトです。
以下のメトリックは、RMI クライアントと RMI サーバの両方に使用できます。
- Average Method Invocation Time (ms)
- Method Invocations Per Interval
- Average Method Invocation Time (ms) by class name
- Method Invocations Per Interval by class name
- Method Invocations Per Second
- Method Invocations Per Second by class name
- Stalled Methods over 30 seconds
- Concurrent Method Invocations
- Concurrent Method Invocations by class name
データベース メトリック(SQL)
各データベース バックエンドは、以下のメトリックをレポートするように設定できます。
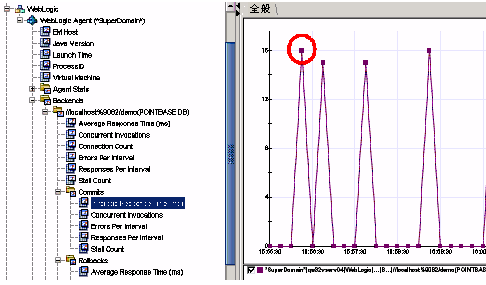
- コミット: 完了した各クエリ/応答トランザクションは、コミットと呼ばれます。 5 つの標準的なメトリックは、一定の間隔中にコミットするすべてのトランザクションに対して収集され、表示されます。 たとえば、以下のスクリーンショットでは、円で囲まれたデータ ポイントが、その間隔中にコミットされたすべてのデータベース トランザクションの平均応答時間を表しています。
- ロールバック: ロールバックは、正常に完了しなかったクエリ/応答トランザクションです。 5 つの標準的なメトリックは、一定の間隔中にロールバックするすべてのトランザクションに対して収集され、表示されます。
- SQL
![この図は、メトリック ブラウザ ツリーを示しています。ツリーは展開され、[Dynamic]ノードと[Prepared]ノードの下に各クエリが表示されています。](o1470861.png)
一定の間隔中にデータベースによって処理された各ステートメントについて、次の 6 つのメトリックがレポートされます。
- Average Response Time (ms)
- Concurrent Invocations
- Errors Per Interval
- Connection Count
- Responses Per Interval
- Stall Count
以下の点に注意してください。
- これらのステートメントは、事前定義および動的のどちらであるかによって、サブノードごとに分離されます。
- 各タイプの SQL ステートメント(GRANT、UPDATE、QUERY、REVOKE、DROP)は、そのステートメント タイプのサブノードの下にリスト表示されます。
XML(拡張マークアップ言語)
XML メトリックには、以下のタイプがあります。
SAX
- SAX:Average Method Invocation Time (ms)
- SAX:Method Invocations Per Interval
- SAX:Average Method Invocation Time (ms) by class name
- SAX:Method Invocations Per Interval by class name
- SAX:Method Invocations Per Second
- SAX:Method Invocations Per Second by class name
- SAX:Stalled Methods over 30 seconds by class name and method name
- SAX:Concurrent Method Invocations
- SAX:Concurrent Method Invocations by class name
XSLT
- XSLT:Average Method Invocation Time (ms)
- XSLT:Method Invocations Per Interval
- XSLT:Average Method Invocation Time (ms) by class name
- XSLT:Method Invocations Per Interval by class name
- XSLT:Method Invocations Per Second
- XSLT:Method Invocations Per Second by class name
- XSLT:Stalled Methods over 30 seconds by class name and method name
- XSLT:Concurrent Method Invocations
- XSLT:Concurrent Method Invocations by class name
JAXM
- JAXM|Listener:Average Method Invocation Time (ms)
- JAXM|Listener:Method Invocations Per Interval
- JAXM|Listener:Average Method Invocation Time (ms) by class name
- JAXM|Listener:Method Invocations Per Interval by class name
- JAXM|Listener:Method Invocations Per Second
- JAXM|Listener:Method Invocations Per Second by class name
- JAXM|Listener: Stalled Methods over 30 seconds by class name and method name
- JAXM|Listener:Concurrent Method Invocations
- JAXM|Listener:Concurrent Method Invocations by class name
J2EE コネクタ
- Average Method Invocation Time (ms)
- Method Invocations Per Interval
- Average Method Invocation Time (ms) by class name
- Method Invocations Per Interval
- Method Invocations Per Second
- Method Invocations Per Second by class name
- Stalled Method count over 30 seconds by class name and method name
- Concurrent Method Invocations
- Concurrent Method Invocations by class name
JTA (Java Transaction API)
- Average Method Invocation Time (ms)
- Method Invocations Per Interval
- Average Method Invocation Time (ms) by class name
- Method Invocations Per Interval by class name
- Method Invocations Per Second
- Method Invocations Per Second by class name
- Stalled Methods over 30 seconds by class name and method name
- Concurrent Method Invocations
JNDI(Java 名前付けおよびディレクトリ インターフェース)
JNDI メトリックには、次のものが含まれます。
JNDI Lookup
- Lookup:Context Average Method Invocation Time (ms)
- Lookup:Context Method Invocations Per Interval
- Lookup:Context Average Method Invocation Time (ms) by class name
- Lookup:Context Method Invocations Per Interval by class name
- Lookup:Context Method Invocations Per Second
- Lookup:Context Method Invocations Per Second by class name
- Lookup:Context Stalled Methods over 30 seconds by class name and method name
- Lookup:Context Concurrent Method Invocations
- Lookup:Context Concurrent Method Invocations by class name
JNDI lookupLink
- lookupLink:Context Average Method Invocation Time (ms)
- lookupLink:Context Method Invocations Per Interval
- lookupLink:Context Average Method Invocation Time (ms) by class name
- lookupLink:Context Method Invocations Per Interval by class name
- lookupLink:Context Method Invocations Per Second
- lookupLink:Context Method Invocations Per Second by class name
- lookupLink:Context Stalled Methods over 30 seconds by class name and method name
- lookupLink:Context Concurrent Method Invocations
- lookupLink:Context Concurrent Method Invocations by class name
JNDI search
- Search:Context Average Method Invocation Time (ms)
- Search:Context Method Invocations Per Interval
- Search:Context Average Method Invocation Time (ms) by class name
- Search:Context Method Invocations Per Interval by class name
- Search:Context Method Invocations Per Second
- Search:Context Method Invocations Per Second by class name
- Search:Context Stalled Methods over 30 seconds by class name and method name
- Search:Context Concurrent Method Invocations
- Search:Context Concurrent Method Invocations by class name
JNDI called metrics
JMS (Java メッセージング サービス)
JMS には、以下の 4 つのサブノードがあります。
- message listener
- message consumer
- topic publisher
- queue sender
以下のメトリックは、上記のどのサブノードの下にも表示可能です。
- Average Method Invocation Time (ms)
- Method Invocations Per Interval
- Average Method Invocation Time (ms) by class name
- Method Invocations Per Interval by class name
- Method Invocations Per Second
- Method Invocations Per Second by class name
- Stalled Methods over 30 seconds by class name and method name
- Concurrent Method Invocations
- Concurrent Method Invocations by class name
Java Mail
Java Mail には、以下の 2 つのサブノードがあります。
- Java Mail (Send)
- Java Mail (sendMessage)
以下のメトリックは、Send サブノードまたは sendMessage サブノードの下に表示可能です。
- Transport:Average Method Invocation Time (ms)
- Transport:Method Invocations Per Interval
- Transport:Average Method Invocation Time (ms) by class name
- Transport:Method Invocations Per Interval by class name
- Transport:Method Invocations Per Second
- Transport:Method Invocations Per Second by class name
- Transport:Stalled Methods over 30 seconds by class name and method name
- Transport:Concurrent Method Invocations
- Transport:Concurrent Method Invocations by class name
CORBA
- Average Method Invocation Time (ms)
- Method Invocations Per Interval
- Average Method Invocation Time (ms) by class name
- Method Invocations Per Interval by class name
- Method Invocations Per Second
- Stalled methods in any class over 30 seconds
- Concurrent Method Invocations
- Concurrent Method Invocations by class name
Struts
- Average Method Invocation Time (ms)
- Method Invocations Per Interval
- Average Method Invocation Time (ms) by class name and method name
- Method Invocations Per Interval by class name
- Method Invocations Per Second
- Method Invocations Per Second by class name
- Stalled Methods over 30 seconds by class name and method name
- Concurrent Method Invocations
- Concurrent Method Invocations by class name
Instance Counts
インスタンス数メトリックは、ヒープの特定のクラスのオブジェクト インスタンスの数を測定します。
- パッケージとクラス名ごとにインスタンス数の概数を求めます
Copyright © 2013 CA.
All rights reserved.
|
|