

Troubleshooting › Operations › Example 1: Performance Problems with an Application
Example 1: Performance Problems with an Application
A user from corporate headquarters reports they are experiencing a problem with an application.
Approach
Gather the problem information from the user and create a trouble ticket.
- Click the Operations page.
- Click Applications in the Show Me menu.
The Performance by Application page opens.
- Determine if the reported application has bubbled up in the list to the top. Typically it is among the top ten. If the application does not appear in the top ten, change the Size setting to a larger value until the application appears in the list. If the application is not in the list, it might not be monitored by CA Application Delivery Analysis.
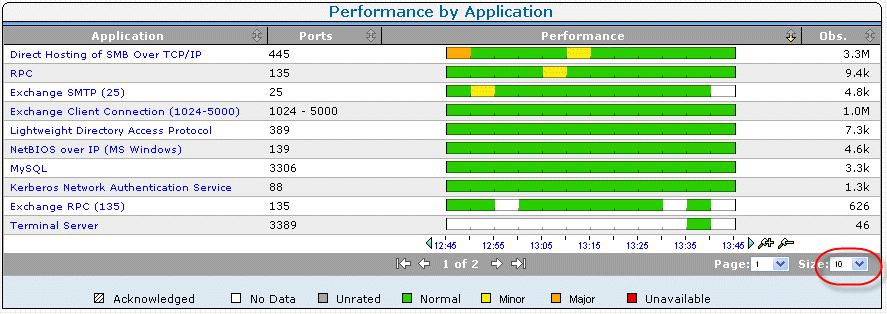
- Click the performance bar to the right of the application name to display a detail page. From the detail page, you can narrow the scope of data by clicking a network or server metric.
- If the network or server is known, select the appropriate performance bar to further narrow the scope.
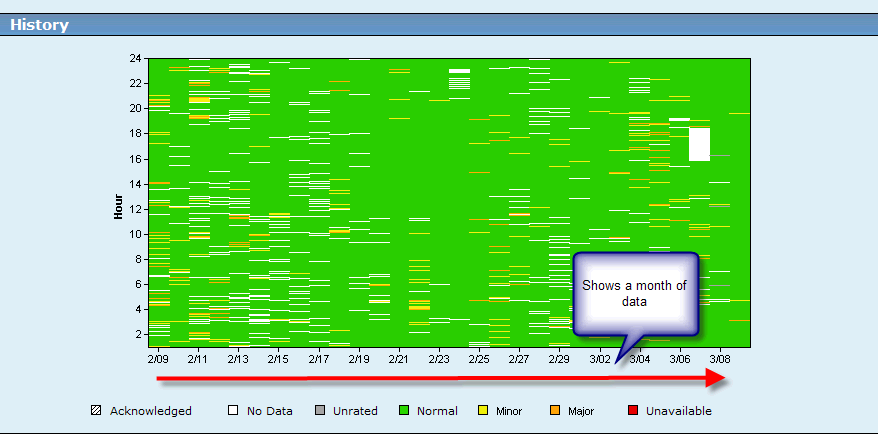
- In the Show Me menu, click History.
- Review the history of the application to identify and note any systematic patterns of unavailability or performance degradation.
- In the Show Me menu, you can also click Performance and then click Explore to begin troubleshooting. You can also do more exhaustive troubleshooting by clicking Links: Engineering at the top of the page to display the Response Time Component Delays page. Notice the selected application name and server or network name in the query selection box at the top of the page.
- Review the Response Time Composition: Average view, and pinpoint the time that the reported issue occurred. Identify which component is the most significant contributor at that point in time.
Copyright © 2015 CA Technologies.
All rights reserved.
|
|