

If you enabled availability monitoring, the management console monitors both application and server availability. When there is an interruption in service, it could be caused by one or the other. This section discusses the method to explore that data.
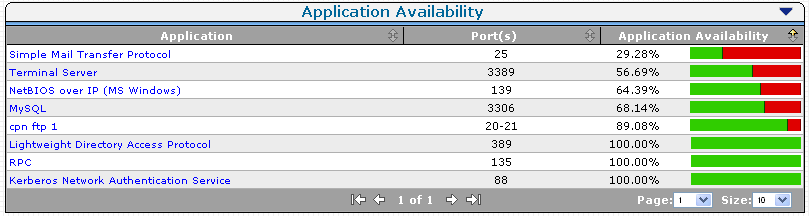
The Application Availability report opens.
The Server Availability report opens.
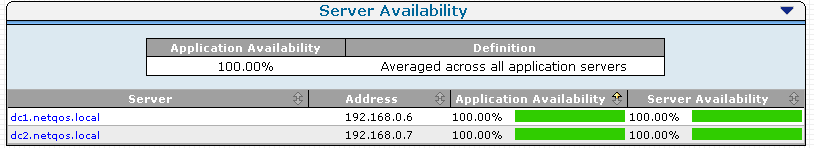
Note: When an application is 100% available (green), the Server Availability view can show some servers as not 100% available. For an application to be available, is it not necessary for every server in the farm to be available. The CA Application Delivery Analysis administrator specifies the number of servers in a farm that must be available for the application server to be considered available.
|
Copyright © 2014 CA Technologies.
All rights reserved.
|
|