

Analysis › Use the Performance Scorecard
Use the Performance Scorecard
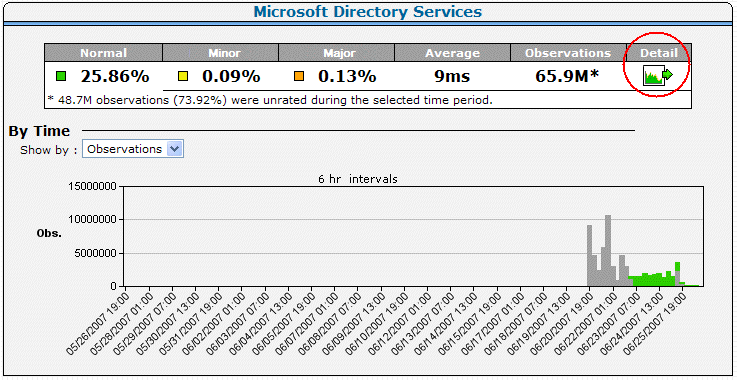
On the Management page, click Performance Scorecard. The resulting Application List page shows how applications perform in the enterprise each month. The Application List page rates performance using the following color coding:
- Unrated (gray)
- Normal (green)
- Minor (yellow)
- Major (orange)
The Application List sorts the performance rating for each application by the number of observations.
Follow these steps:
- Click the Management page.
- Click Performance Scorecard in the Show Me menu.
- Scroll to the Application List and click an application.
- Click Settings to change report settings.
- Click a color-coded performance bar or click an application name to obtain detailed information about which servers and networks are not performing in the same way as their peers.
A detailed view of the application shows data by time intervals. Select whether to view the data by Observations or Percentage.
- Click Performance Scorecard and Network in the Show Me menu to view the application details by network.
- Click Performance Scorecard and Server in the Show Me menu to view the application details by server.
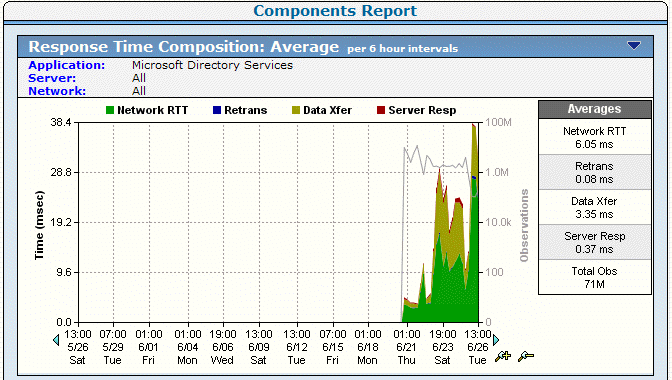
- Click Detail to view a Component Report for the application.
The Components Report page appears.
Copyright © 2014 CA Technologies.
All rights reserved.
|
|