

You can see similar patterns from operations during business days on the following performance views:
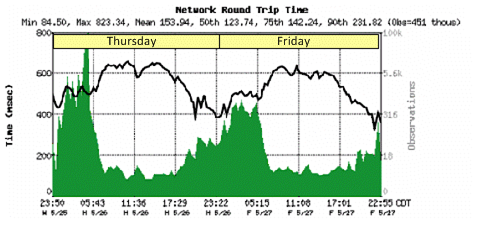
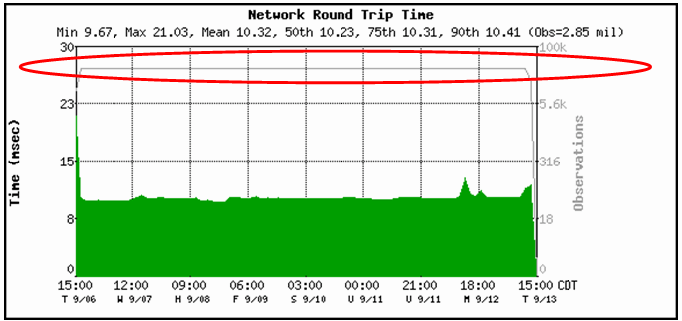
High observation counts correspond to low NRTT during peak hours as indicated:
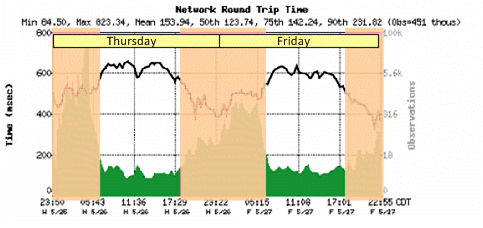
During non-work hours the opposite pattern occurs. The explanation is that overseas users are accessing the applications during nighttime hours, and those circuits experience high latency WAN access. Baselines calculated for time of day and day of week reflect these normal patterns.
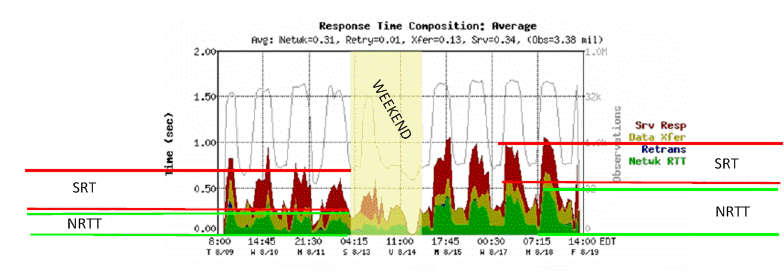
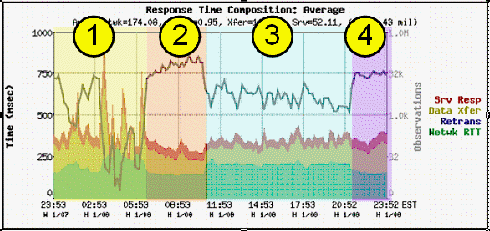
You can also see weekly patterns in the following 10-day view. High volume causes longer NRTT and SRT during peak usage. The NRTT (green) component is greater in the second week than in the first, while the SRT component remains constant. This application has a fairly consistent observation pattern over the time period also. Increase in Response Time the second week is probably because of a network change or a variation in the use of other applications:
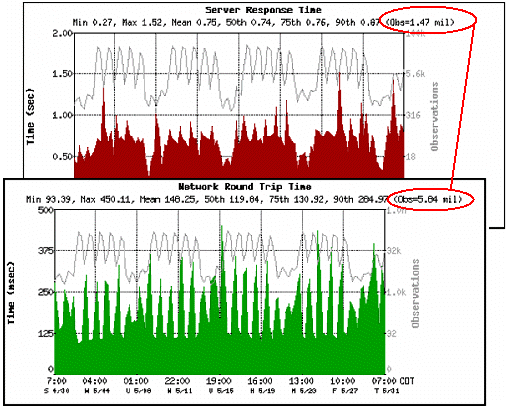
Looking at the monthly patterns, you can see trends that could have implications for capacity planning. In the following example, you can see almost a 4:1 ratio of NRTT observations to SRT observations.
This application averages almost four round trips per TCP transaction. Applications designed to use a high number of turns might be impacted by network degradation more than those with fewer turns.
A flat observation count on a performance view suggests a batch process or an active agent:
The following view shows the daily pattern for the package tracking application of a shipping company.
The patterns occur according to the daily work flow:
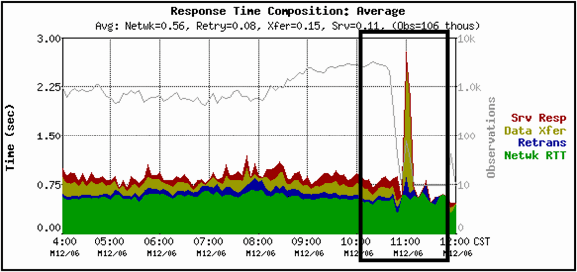
The following view is an example of application failure. The observation count drops off dramatically.
|
Copyright © 2014 CA Technologies.
All rights reserved.
|
|