

In addition to the Windows Client Graph View menu and toolbar options you can also perform some quick appearance changes to the Graph View as follows:
How to perform these changes is explained in the following procedures.
Note: The following options and more options for customizing a view are available in the Windows Client View and Output Definition option. For more information, see the section Customized Reports.
When you switch the object view from Table View to Graph View by clicking the Graph icon in the bottom left corner of the view, the Graph View will display the same amount of items that were displayed in the Table View. For example, if the Table View displayed 8 rows of X records found then the Graph View will display only those 8 items. If you want the Graph View to display more items then switch back to the Table View and expand the window to display more rows. Then when you switch back to the Graph View it will display the same amount of items. For example, if the Table View displayed 8 rows and you expand the Table View to display 10 rows then when you switch to the Graph View it will display 10 items.
You can also use the Sort Option and the Filter Option in order to specify the order of the items and reduce the amount of items you want to display in the graph, prior to switching to the Graph View.
Note: When you print a Graph View, all records (not only the ones displayed in Graph View on your screen) will be included in the printout unless you specify a range in the print option.
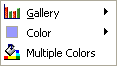
When a Graph View is displayed you can use the Quick Gallery option to change the graph type. (This option is the same as the Gallery icon option found on the Graph View toolbar, this is another method for initializing the same option.)
The Graph Options Menu is displayed as shown in the following sample:
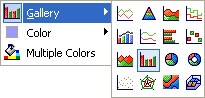
The Graph View is updated and the new graph type selected is displayed.
When you switch to the Graph View, all the bars will have the same color. To apply different colors to the bars you must first use the Quick Multiple Colors Option. Then you can right click a particular bar and specify a color for that bar. The following procedure assumes you have the object displayed in the Graph View and all the bars have the same color.
The Graph Options Menu is displayed as shown in the following sample:
The Graph View is displayed and the graph items are displayed by a different color.
The Graph Options Menu is displayed.
A color chart is displayed as shown in the following sample:
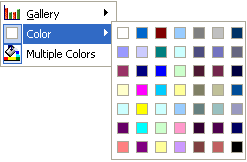
The item in the Graph View is displayed with the color selected.
When you switch to the Graph View, all the bars will have the same color. To apply different colors to the bars you can use the Quick Multiple Colors Option. Then you can right click a particular bar and specify a color for that bar as described in the section Quick Color Option. The following procedure assumes you have the object displayed in the Graph View and all the bars have the same color.
The Graph Options Menu is displayed as shown in the following sample:
The Graph View is updated with each item displayed by a different color.
Note: To return the Graph View so that all items use the same color, right click an item (for example a bar) in the graph and select the Multiple Colors option.
|
Copyright © 2011 CA Technologies.
All rights reserved.
|
|