

The Graph View feature displays a selected set of object data in a graph.
Note: For Web Client users; the Customize View Wizard in the Web Client provides Charting options. These options allow you to create charts (graphs) of object data. For more information, see the CAVantage SRM Web Client Guide.
The Windows Client offers a large variation of graph types to present your data in a variety of formats. Some of the available graph types are:
You can specify the graph type and its format to obtain the kind of display you prefer. You can preview the general look of a graph while defining its various features.
Note: To immediately view certain changes, you must click the Refresh icon (![]() ).
).
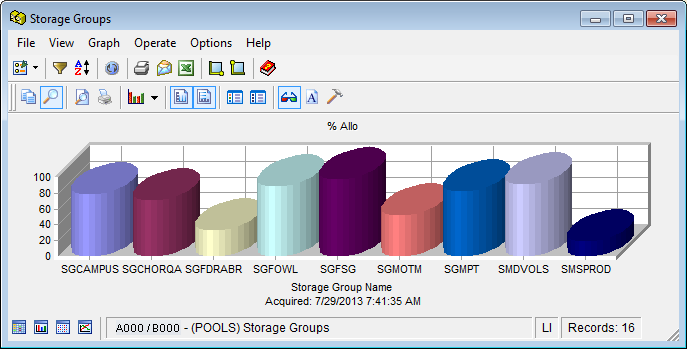
The following is a sample of the Windows Client Graph View of the Storage Groups object:
|
Copyright © 2011 CA Technologies.
All rights reserved.
|
|