

By showing the flow of data between data stores and procedures on the Procedure Hierarchy, the Data Flow Diagram highlights data interactions between procedures and the sequence of procedure execution.
Data Flow Diagrams represent successive levels of detail for the current system.
The flows shown on a Data Flow Diagram are listed in the following table.
|
From |
To |
|
Procedure |
Data store |
|
Data store |
Procedure |
|
Procedure |
Procedure |
|
External object or System |
Procedure |
|
Procedure |
External Object or System |
Data flow diagramming may be useful for complex current systems, for example, where the sequence of a number of procedures, or the interaction of batch and online procedures, is important. In this case, it may be useful to annotate the diagram with the mechanism of each procedure: batch, online, or manual. There is no set notation for recording this property.
The following illustration shows the conventions of Data Flow Diagrams.
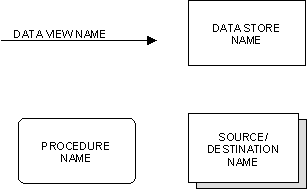
Arrows on the lines represent flows into and from data stores, as well as flows between activities. The direction of the arrows indicates the direction of the flow. For instance, the downward direction of the arrow head indicates the flow from Demand Assessment to Place Purchase Order.
Consider the top level Data Flow Diagram in the following illustration.
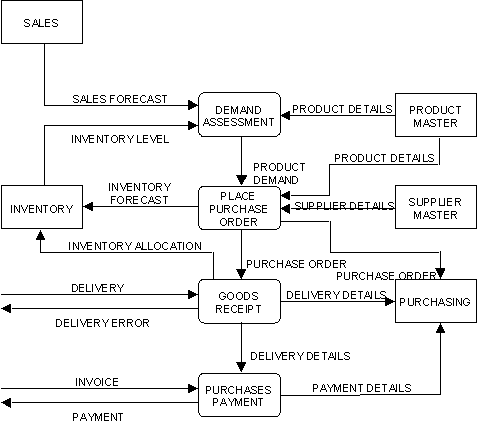
This Data Flow Diagram includes four subsystems:
The diagram also includes five principal data stores:
The following illustration shows more detail of the Place Purchase Order system.
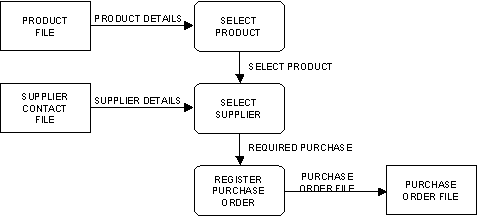
The high-level data stores in the previous top level illustration now appear in this illustration as three, more detailed data stores.
As a starting point, there may already be a Business Systems Architecture Diagram produced during planning, or a Data Flow Diagram for the system showing its procedures.
A complete architecture for business systems should include a diagram for the current systems as a basis for further system development to meet business requirements.
Where systems are being retained (sometimes called legacy systems), current systems also appear on later versions of the Business Systems Architecture. Diagrams for this architecture may not be very detailed, but should provide a basis for drawing a high-level Data Flow Diagram showing interactions of all the current systems to be analyzed.
Complex systems may require more than one level of Data Flow Diagram. If so, develop a series of these diagrams to include each appropriate level of detail. These diagrams might comprise: a single high-level context diagram showing each relevant system; a diagram for each system, showing subsystems or collections of procedures that are performed together; and a diagram for each subsystem showing how the procedures interact.
Guidelines for developing data flow diagrams:
|
Copyright © 2014 CA.
All rights reserved.
|
|