

This topic contains examples of the kind of flowcharts you can use to organize your jobs into groups. They illustrate an accounts payable system with three different scheduling variations:
The first flowchart shows the daily processing flow. This flow runs Monday through Friday, except the first and last days of the month.
The second flowchart shows the first day of the month. This flow processes the normal daily jobs, and several monthly jobs.
The third flowchart shows the last day of the month. This flow processes some of the normal daily jobs and some different monthly jobs.
The only job in this sample system that is calendar-scheduled is JOB01:
The rest of the jobs are triggered in:
Following the three standard flowcharts are three alternate flowcharts. They reflect the same relationships as the standard flowcharts but use a format that is similar to the output from the CA Workload Automation SE FSTRUC command. If you find it easier to work with, you can use this format. You can then use the output from the FSTRUC command to ensure that you defined your schedules correctly.
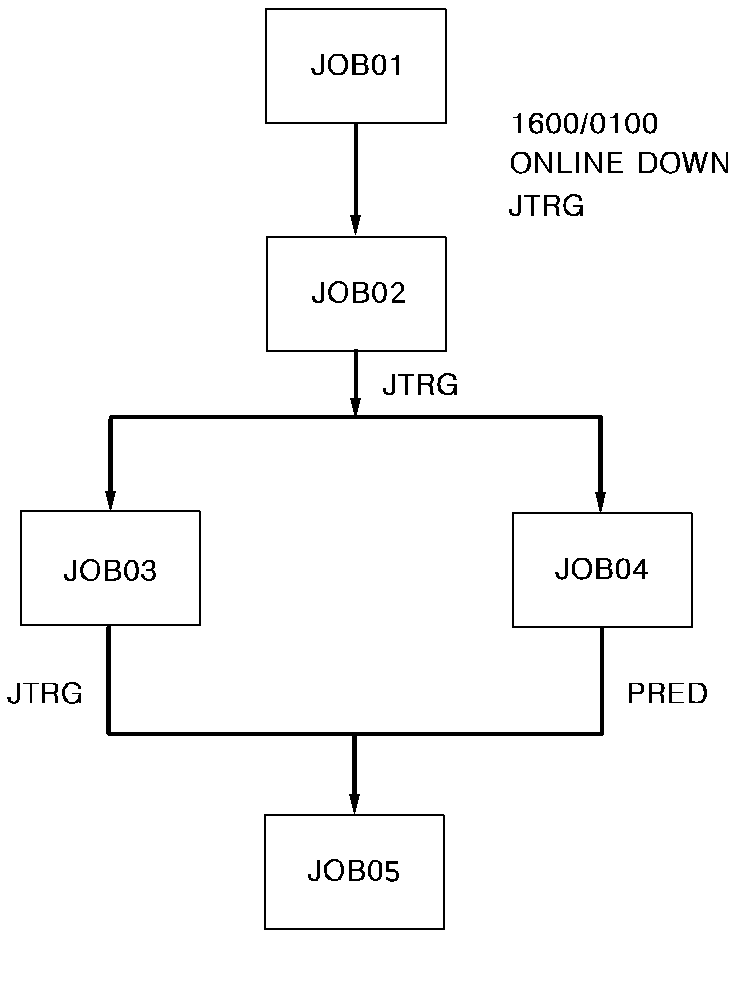
The following is a sample flowchart for SCHID=1.
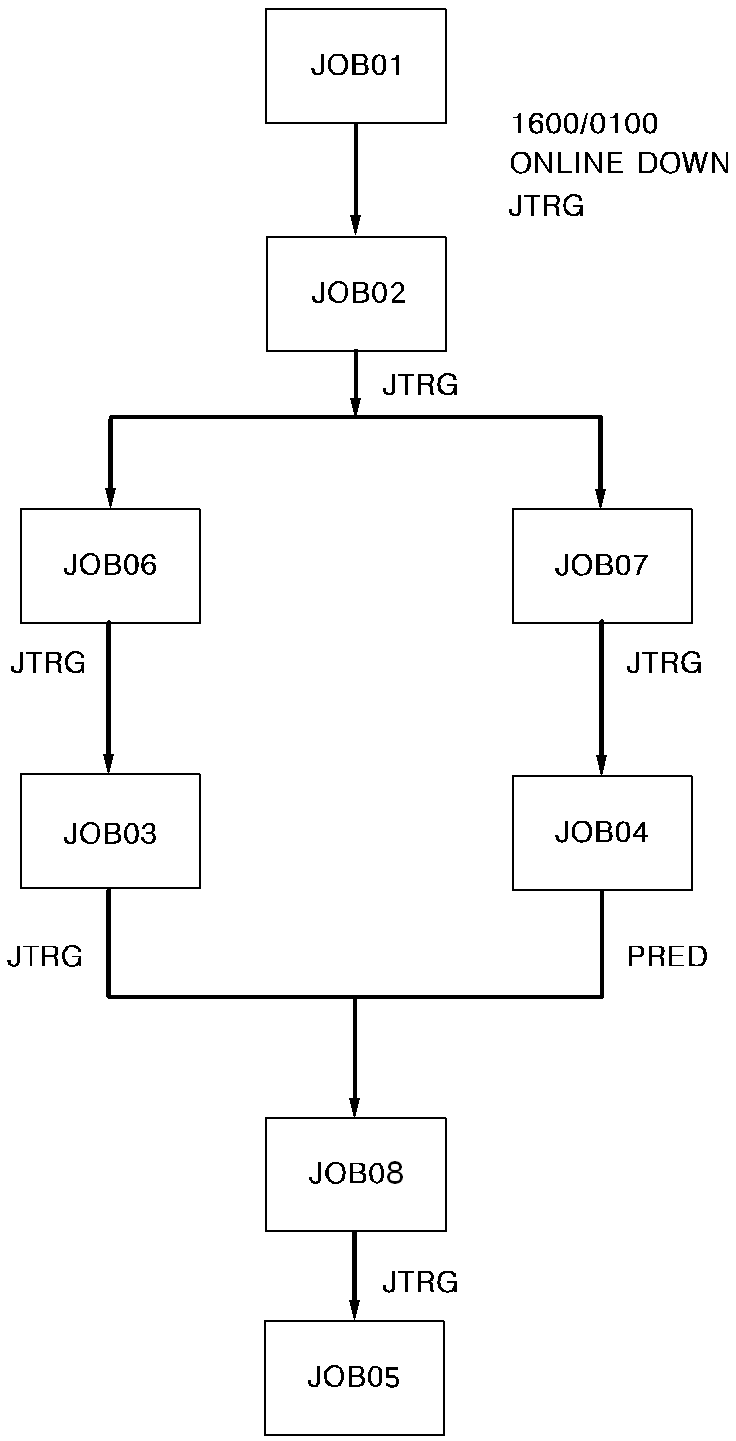
The following is a sample flowchart for SCHID=2.
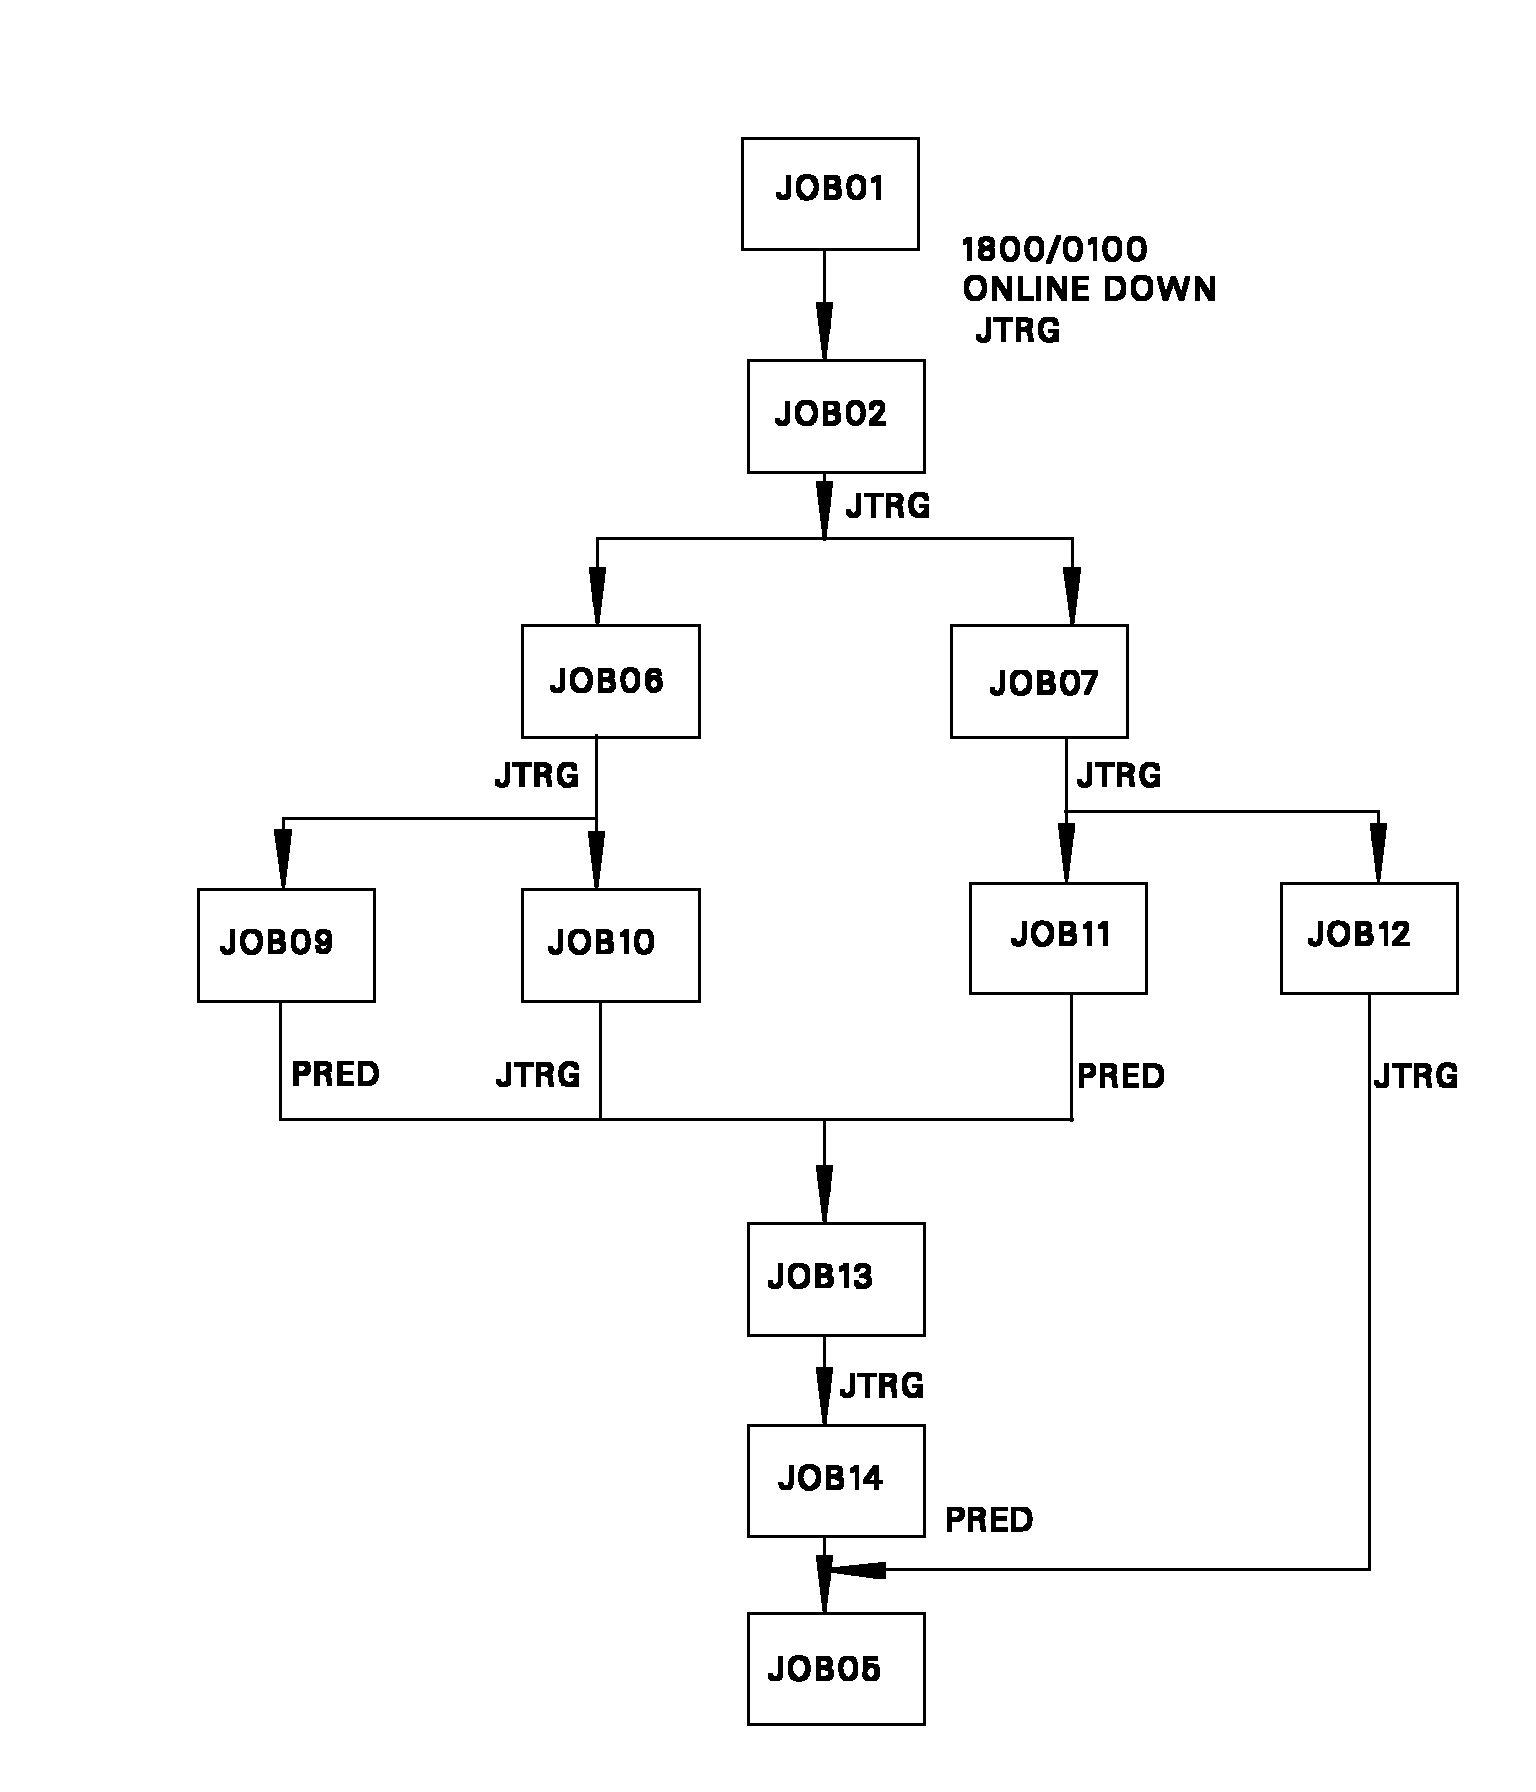
The following is a sample flowchart for SCHID=3.
The following is an alternate flowchart for SCHID=1, daily flow.
Jobname                   DOTM/LDTM               Requirements


JOB01                     1600/0100               Online down
  JOB02
    JOB03
      JOB05                                       JOB04
    JOB04
The following is an alternate flowchart for SCHID=2, first day of month.
Jobname                       DOTM/LDTM               Requirements


JOB01                         1600/0100               Online down
  JOB02
    JOB06
      JOB03
        JOB08                                         JOB04
          JOB05
    JOB07
          JOB04
The following is an alternate flowchart for SCHID=3, last day of month.
Jobname                         DOTM/LDTM               Requirements


JOB01                           1800/0100               Online down
  JOB02
    JOB06
      JOB09
      JOB10
        JOB13                                           JOB09, JOB11
          JOB14
    JOB07
      JOB11
      JOB12
            JOB05                                       JOB14
|
Copyright © 2013 CA Technologies.
All rights reserved.
|
|